Proud to be Sponsoring The Tableau 9.0 Roadshow…
Register for an upcoming roadshow here. Since the release of Beta 9.0, the InterWorks team have been getting excited over the numerous new and enhanced features the upgrade brings. We’ve written blogs, held webinars and have eagerly been awaiting its public launch. We’re getting ever closer to launch date; and in celebration, we’ll be sponsoring the […]
Using Pivot in Tableau 9.0 for Sensitivity Analysis
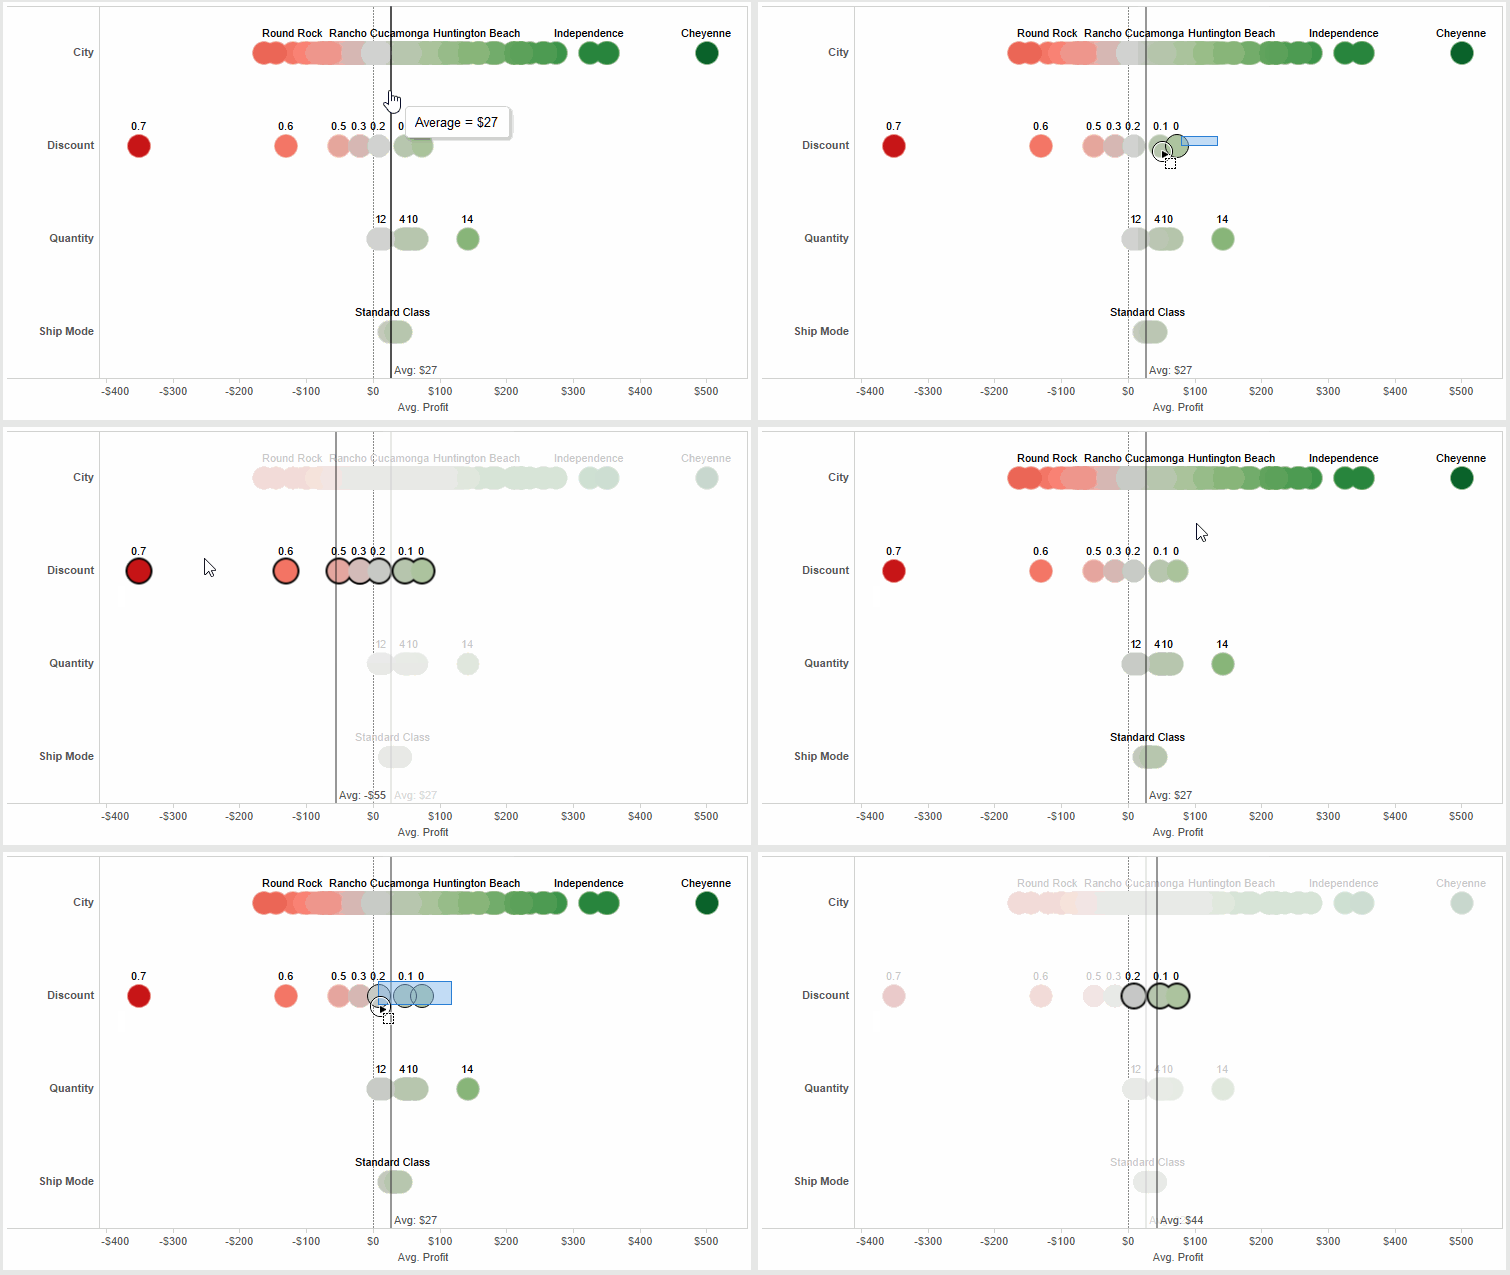
So, you’ve officially unlocked your business’ data in Tableau. There’s no denying how easy it is to gain immediate insight by simply clicking and dragging, but as you progress on your journey of data discovery, you inevitably end up asking more specific questions about your data and how it affects business decisions. Questions like: What […]
10 Questions for Data Viz Expert & Data Artist KK Molugu
I first became aware of KK about a year ago through his interesting Tableau Public visualizations and his activity on Twitter. Earlier this year, I was fortunate to speak with him at an event in Chicago and was able to spend 90 minutes eating lunch and chatting about data visualization, Tableau and data in general. […]
Thoughts on the 2015 Esri Developer Summit

Last week, I had the opportunity to attend my third Esri Developer Summit in Palm Springs, Calif. This is Esri’s third largest conference on their calendar, hosting 1,800 GIS professionals and developers. This is also their tenth Developer Summit, and they continue to find new and interesting ways to grow the already strong GIS development […]
Visualiser des données d’Internet dans Tableau – Velib à Paris
Disponible en Anglais J’aime les données et je cherche toujours de nouveaux moyens de rendre de nouvelles données accessibles aux utilisateurs de Tableau. Dans cet exemple, je vais montrer comment accéder à des données d’Internet via une API REST. Cela peut sembler un peu complexe mais c’est assez simple à adapter à vos besoins réels. […]
The Tableau Performance Checklist: Data – Bring in Only Needed Data
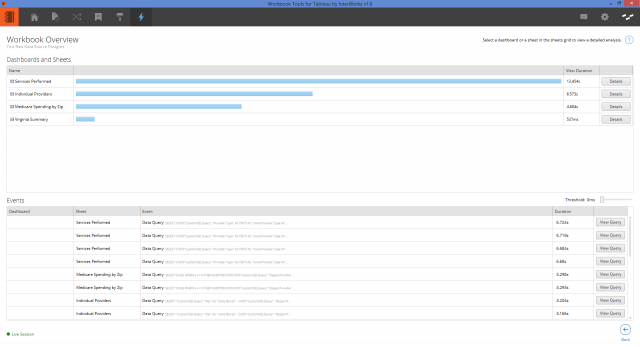
This post is about boosting Tableau’s performance through data selection. Let’s address the second performance enhancing idea in the Data section of the Tableau Performance Checklist: “Bring in only the data needed for analysis. Consider adding a data source filter or using an extract. If using a join, minimize the number of joined tables.” In […]
NCAA March Madness – The Seed Game

The NCAA March Madness Tournament is known for upsets. Each year, there are a few low-seeded teams that come out of nowehere and surprise everyone. It’s called March Madness for a reason. But how deep do these underdog teams really go in the tournament? Using Tableau, I took a look at data from 1985 to […]
DataGravity Discovery Series Solution Short: File Management
This is the fifth post in yet another blog series covering DataGravity’s Discovery Series. We’re calling this group our “Discovery Series Solution Shorts,” and these posts give you a broad overview of key features found in the Discovery Series. This post focuses on how DataGravity helps you manage files more effectively. You can view all […]
Getting Excited about Tableau 9.0!
Here at InterWorks, we’ve all been getting very excited about the upcoming release of Tableau 9.0, with many of us trying out and discovering the numerous enhancements the upgrade brings. If you’ve yet to download the beta version, or are keen to find out more about any of the features, check out our webinar series […]
Cohort Analysis in Tableau: User Retention Given Only Created and Last Seen Dates
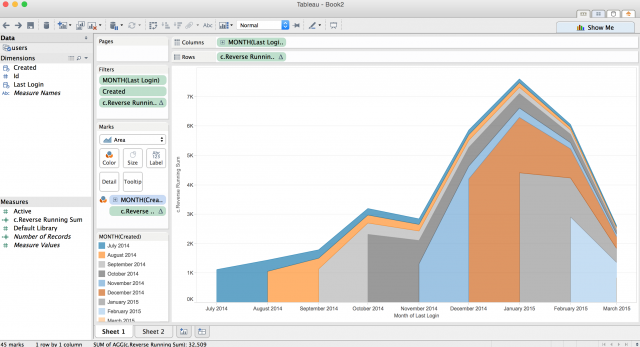
Cohorts have been the go-to analysis for user retention for a while now, and Tableau has a great article on how to go about creating different types of cohorts. However, when our data set is limited, we may have to create some workarounds. An Example The data set I’m working with is for an online service. […]
