
So, you’ve officially unlocked your business’ data in Tableau. There’s no denying how easy it is to gain immediate insight by simply clicking and dragging, but as you progress on your journey of data discovery, you inevitably end up asking more specific questions about your data and how it affects business decisions. Questions like:
What has the biggest impact on the bottom line? Will efficient shipping methods help more than optimizing discounts, or should we look more closely at marketing in certain cities?
One way to approach this is with sensitivity analysis – a way to describe the effect that certain variables have on expected outcomes. In this post, I’ve proposed a modified type of sensitivity analysis using the Pivot feature in Tableau 9.0 to quickly understand key drivers of variability in a selected metric.
What Is Sensitivity Analysis?
Sensitivity analysis is usually meant to help understand risks and is typically included in predictive modeling such as Monte Carlo simulations. There will be a low, high and middle expectation for certain values which affect a targeted outcome. A mathematical model of some kind will define how each value affects the other, and hundreds or thousands of combinations will be simulated to generate the outcome.
Results may include a tornado chart (example from Wikipedia below) to depict each input’s influence on that simulation:
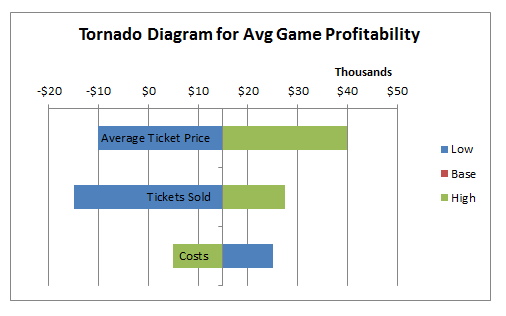
I would argue that such analysis doesn’t have to be strictly forward-looking. Defining a model often involves looking into historical data in order to find the expected high, low and middle values for each input. If we have no model to test but can find how each value has affected an outcome in the past, we can make similar plots to see what happens when key values change.
Pivoting Data in Tableau 9.0
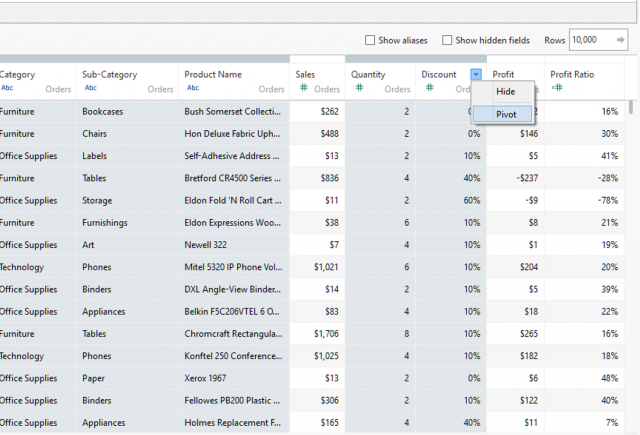
To get started with pivoting data in Tableau, we’ll need to set up the data in a way that puts dimension names into one column, or a dimension of dimensions. We’ll do the same for every field except for those which we may want to treat as outcome variables. In this case, that would be Sales, Profit and Profit Ratio. In Tableau 9.0 (currently in Beta), select all fields then use the arrow menu to select Pivot as shown below:
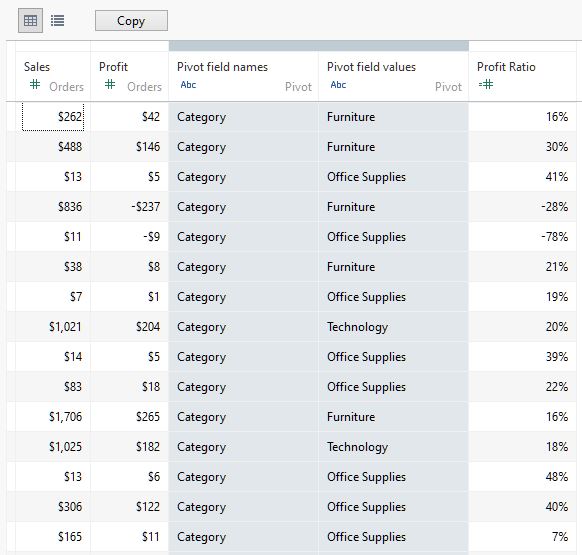
Once you’ve done that, the data preview should now look like this:
Setting Up the Analysis
With this setup, we can treat each dimension as its own variable. Changing only one variable at a time while holding all other constant will show the effects of those changes on metrics like profit. We’ll start by looking at average profit across all available variables. Here is how the worksheet should look:
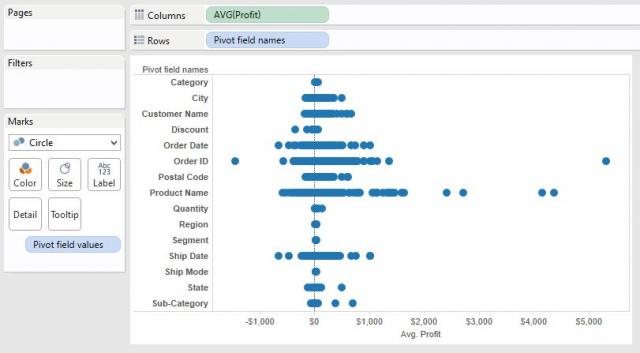
Many of the values shown above are redundant or won’t have much value in determining what drives changes in profit. Here are some general guidelines on finding the most relevant values:
- Remove values at lower levels of detail like Order ID, Product Name and Ship Date since each mark will have a very small effect on the overall outcome.
- Group hierarchies like Region, State, City and ZIP, or choose only one level such as City.
- Focus mainly on variables which you can reasonably control.
I chose to keep City, Discount, Quantity and Ship Mode in view while adding color and a reference line to highlight the average and positive/negative values. I have also sorted it so that the dimensions with the largest difference between minimum and maximum values are at the top:
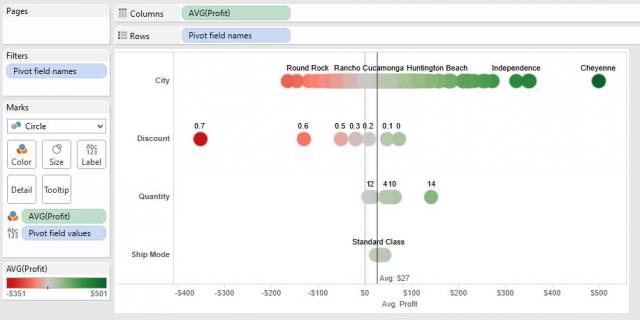
Note that filtering out some dimensions in this view will change the overall average. For more accurate results, we could compute the average of the entire data set with a fixed Level of Detail calculation (such as “{AVG([Profit])}”).
Furthermore, we could modify the plot above to compare all values against that average. In this data set, doing so had no meaningful impact on the results above, but that may not be the case everywhere.
Understanding the Results
This chart shows that where a product is sold has the largest variability, followed by discount. We can put aside questions about how changes to shipping modes and bulk quantities may help business since these will have minimal effect. We could dig further into why certain cities fare better than others and possibly adjust marketing or supply chain factors based on that, but a cursory check in Tableau shows that this variable is not driving profits up or down overall.
Instead, let’s focus on discount, which has a large negative effect on profits. This may seem obvious, but for the sake of this example, let’s assume it isn’t. Tableau 9.0 will recalculate reference lines based on user selections. By selecting only the discount marks, as shown below, we find that our overall average would be significantly lower if all other variables stayed the same and we only changed discounts. If we choose only the discount values that result in positive profit, we see how that would improve the average – again, assuming all other values were constant.
There is normally much more involved in true sensitivity analysis. This simplified version is best used as a starting point for more in-depth analysis. One important thing to consider is that values at the ends may have a small effect on the overall average if the number of transactions is relatively small.
Further Exploration
Now we have an area which could warrant more rigorous investigation. We may focus more efforts on optimizing discounts knowing that decision will have the greatest positive impact on profits. We may do the same with other important outcomes like revenue or profit ratio. Importantly, we have avoided “analysis paralysis” by narrowing our questions using Tableau’s simplicity and speed.