10 Questions for Tableau Trainer Extraordinaire Sarah Nell

I met Sarah last year while doing book tour speeches in the Midwest. She drove from Milwaukee to Madison to attend my talk there and the next day in Milwaukee. She was a Tableau Consultant at the time working for a Tableau Partner in Milwaukee that sponsored the event. It was apparent to me that […]
DataGravity Discovery Series Solution Short: Data Protection
This is the fourth post in yet another blog series covering DataGravity’s Discovery Series. We’re calling this group our “Discovery Series Solution Shorts,” and these posts give you a broad overview of key features found in the Discovery Series. This post focuses on how DataGravity enhances your data governance capabilities. You can view all posts […]
Tableau Essentials: Formatting Tips – Maps
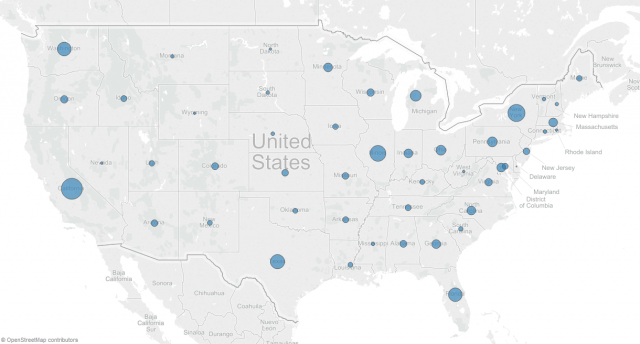
We’ve covered symbol maps and filled maps in our review of all of the different types of chart types in earlier articles. Today, we’re going to look at some of the formatting options you can apply to your maps beyond formatting the marks and fills. Let’s start with a simple map, exploring sales across the continental United States. We’ve […]
Tableau Recognized as a Leader in Gartner Magic Quadrant for Third Consecutive Year
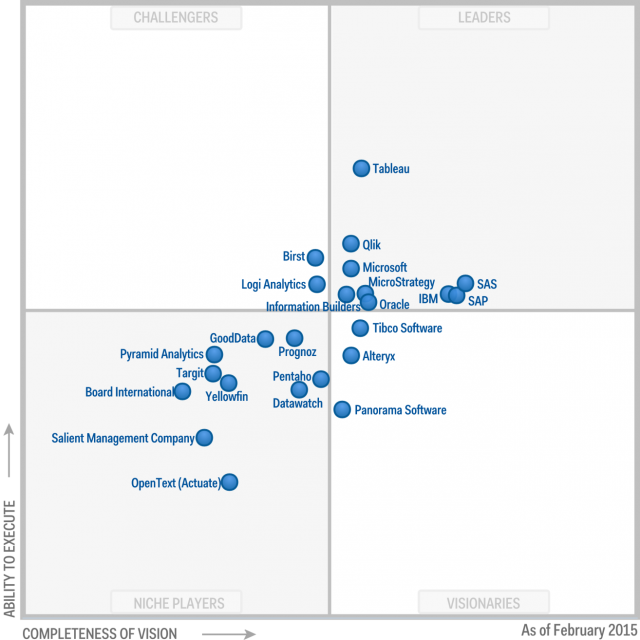
Tableau purchased Power Tools in 2019. Contact Us for more information. Can you say, three-peat? Gartner just released their annual Magic Quadrant for Business Intelligence and Analytics, and wouldn’t you know it, Tableau was listed as a Leader yet again. That makes this the third consecutive year in which Tableau has landed in the Leaders category. […]
I Hate When Tableau Does That: Calculated Fields Edition
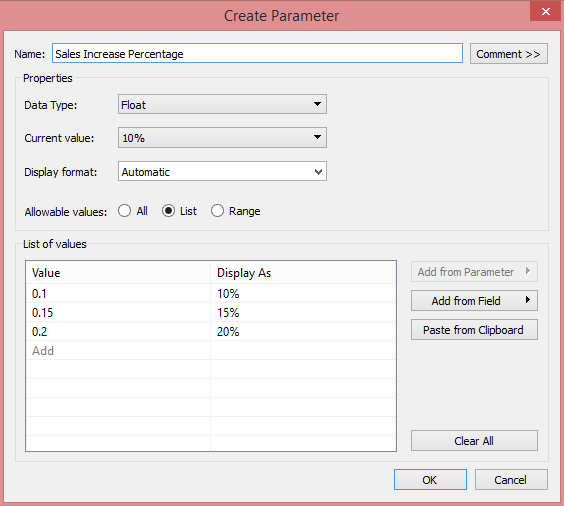
Calculated fields are a staple of almost every workbook I create. There’s always a need to add a field to the original set of dimensions or measures to either enhance a visualization or to add powerful analysis on the fly without having to re-write the original data set. Here’s an example often used in the […]
Drill Down and Up by Date Inside of a Tableau Line Chart
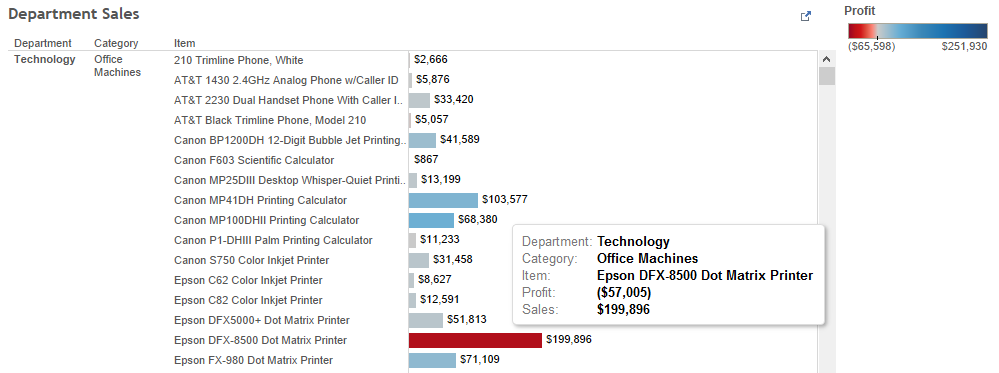
Hierarchies in Tableau are a great way to offer a high-level summary with the option to drill down into the data. For example, in the Sample Superstore extract, you can go from feeling great about Technology sales to worrying about losing money on DFX-8500 printers in seconds! In line charts, you can drill down inside […]
The Tableau Performance Checklist

Ask Tableau users what they love most about Tableau, and they’ll likely say it’s the ability to create stunning data visualizations quickly and easily. Tableau was designed with usability in mind, apparent in its approachable interface, yet behind that interface lies a powerful collection of components capable of cranking out complex data visualizations at lightning […]
OpenManage Alerts in Kaseya
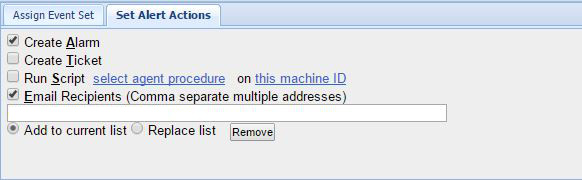
I’ve seen this come up several times and finally decided to write a blog on it. It’s pretty straightforward: Kaseya gathers event logs, and Dell’s OpenManage puts events into System Administrator in the System event logs. Let’s put two and two together and make Kaseya let us know when OpenManage reports something wrong. This is […]
10 Questions for VizNinja Paul Banoub

I became aware of Paul Banoub a couple of years ago via Twitter and then his blog. Paul started doing interviews of Tableau community members a while ago. I didn’t realize that until I started digging into his website for this post. Paul is generous, enthusiastic and a great example of why the Tableau community […]
Power Tools for Tableau Named Tableau Technology Partner

Tableau purchased Power Tools in 2019. Contact Us for more information. Power Tools for Tableau, an extension of InterWorks, officially achieved Tableau Technology Partner status last week. The Tableau Technology Partner list is comprised of organizations that create complementary products to Tableau Software. In short, these partners are recognized for their ability to enhance Tableau, making […]
