InterWorks OKC Open House 2015: Celebrating Seven Years of Growth

We at InterWorks are opening the doors of our OKC office for a day of fun, networking and client appreciation. Whether you’re an old friend or a new acquaintance, or even if we haven’t met you yet, we’d love for you to join us at our place from 10 a.m. to 2 p.m. on April […]
The Tableau Community Mosaic
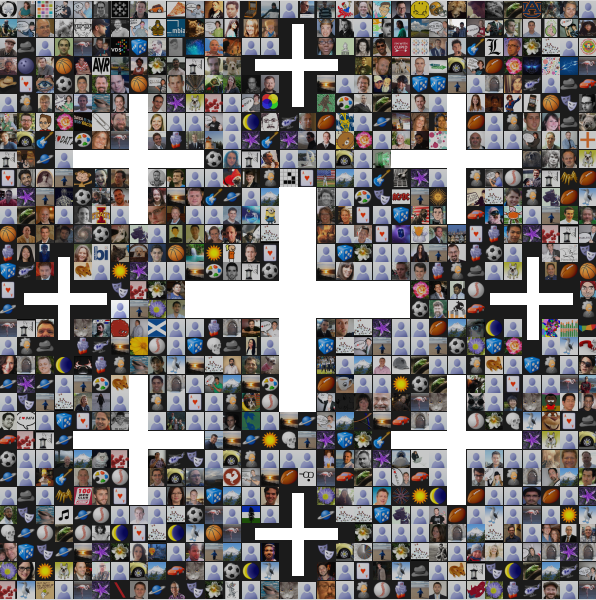
It’s been said before, but what makes Tableau unlike any other data visualization tool out there is the community surrounding it. People don’t just use Tableau – they live it. There are so many helpful resources out there, be it blogs or social media channels, but there is no better place to see this community […]
Blurring the Border Between Data and Journalism at Arizona Migrahack

At the heart of the American Southwest, Arizona is a state known for its natural beauty and its unique cultural history. Though it’s been a melting pot for some time, its modern-day position on the US-Mexican border combined with the geopolitical events of the past few decades has transformed it into ground zero for controversial […]
Volume Activation for Windows: Configuring KMS with AD Roles for Windows 2012 / 2012R2
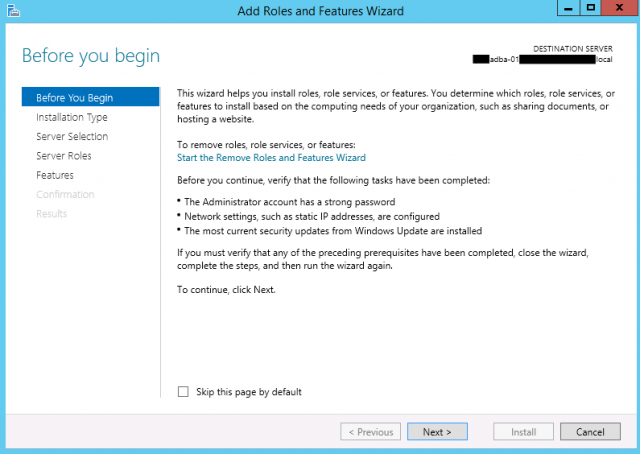
This is the second post in an ongoing series that discusses volume activation and management. This article shows the installation for installing KMS through server roles on a Windows Server 2012 or Windows 2012R2 Server. You can find all posts within this series on our Volume Activation for Windows channel. With Microsoft Windows 2012 now having been out […]
10 Questions for TUG Builder Mike Moore

I met Mike via Twitter several years ago. I thought he was a deranged stalker because he retweeted just about everything I put out. Then we were engaged by his company to do some training/consulting work. After meeting Mike, I realized he was just very passionate about data visualization and a really nice guy. After […]
Use This Script to Push or Pull Replication for a Windows Domain Controller (2003, 2008, 2012)

If you would like to avoid using the AD Sites and Services GUI to force replication across your domain controllers, consider the script below. Save this as a .bat file to a machine on the same domain as your domain controllers and run as a domain administrator. The script will prompt you for the desired […]
The Tableau Performance Checklist: Data – Use One TDS File
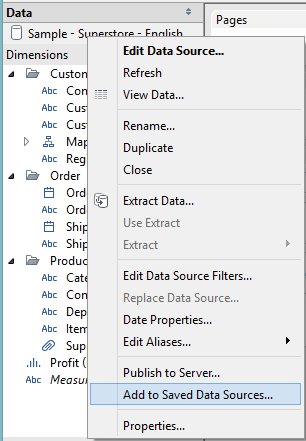
This post is on how to make use of TDS files to easily share metadata about a data source with others. We will be digging into the fifth point in the data section of the Tableau Performance Checklist: “Create a published TDS file for your business team to use rather than each analyst creating their […]
Adding Traditional User Desktop Icons to Windows 2012 / 2012R2
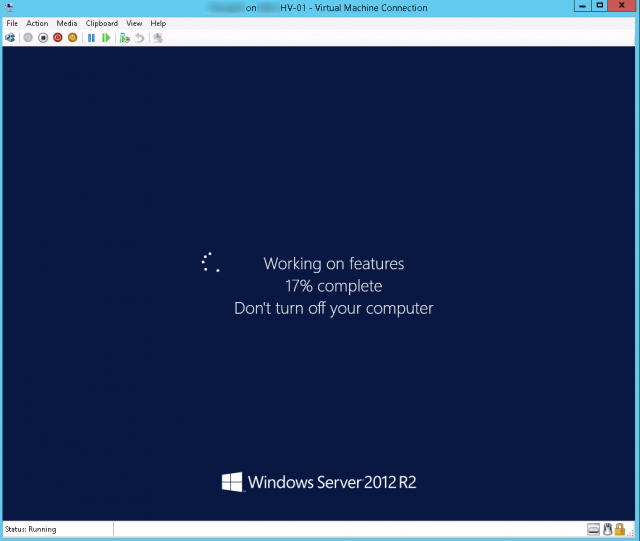
When installing a fresh copy of Windows 2012 or 2012R2, some of the more common items on the desktop, such as My Computer, User’s Files, Network, Control Panel are missing or no longer part of the default configuration. On a Windows 7 or 8 machine, to add these icons you could right-click on the desktop […]
Tableau Essentials: Calculated Fields – Number Functions
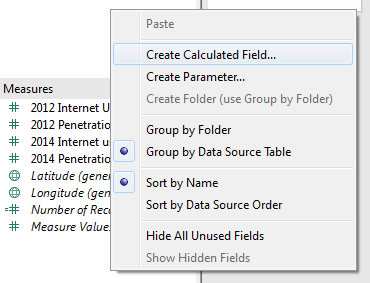
Not everyone is a Tableau guru, at least not yet. To help Tableau rookies, we’re starting from square one with the Tableau Essentials blog series. The series is intended to be an easy-to-read reference on the basics of using Tableau Software, particularly Tableau Desktop 8.1 and 8.2. Since there are so many cool features to […]
Interacting with your trend line in Tableau (Part 2)
PART 2 In part one we familiarised with Tableau’s automatic Trend Line, information provided and inferences possible. Now I want to focus on the fun part: how to calculate the trend line ourselves using Tableau-R integration as well as two applied examples “How much above/below ?” and “What if”. HOW TO CALCULATE A LINEAR TREND LINE USING TABLEAU & R […]
