
Let it be duly noted that I used the euphemistic term rather than the pejorative “patent troll”.
+1 for me!
What is Patent Trolling?
When an issue makes to the Office of the President of the United States, you know it’s gotten big. Patent trolling, or using patents to extort money from people and companies, has gotten a lot of attention lately and for good reason. Some companies commonly referred to as Patent Assertion Entities have a practice of buying up old and/or very broad patents, (mis)applying them to current technologies, and going after anyone they possibly can for infringement. What this translates to is lost time and financial resources for companies who are in the crosshairs of patent holders looking for easy money. It’s a drain on entrepreneurs who are trying to get funding for start-ups; no one wants to give money to a company embroiled in a lawsuit. In this way, many have accused these patent-wielding ne’er-do-wells of stifling innovation. As such, there are several bills in both houses of Congress now, all of which try in various ways to limit the effects of egregious patent litigation.

It’s a sordid state of affairs, and if the very idea of patents doesn’t put you completely asleep, it can be a lot of fun to poke around at the data behind the issue. Lots of companies collect patent litigation statistics and most put out charts and graphs showing various data points and how to draw conclusions based on them. But for the first time, this data has been Tableau’d, rendering it interactive!
Using Data to Measure Prevalence
Using data downloaded from http://www.npedata.com, I was able to input zip codes for all of the Federal Circuit Courts in order to use Tableau’s mapping function to build a picture of where these types of cases are most prevalent. This shows us very quickly which courts the PAEs go to most often, what times of patent-holders are filing the suits, and what the actual case names are.
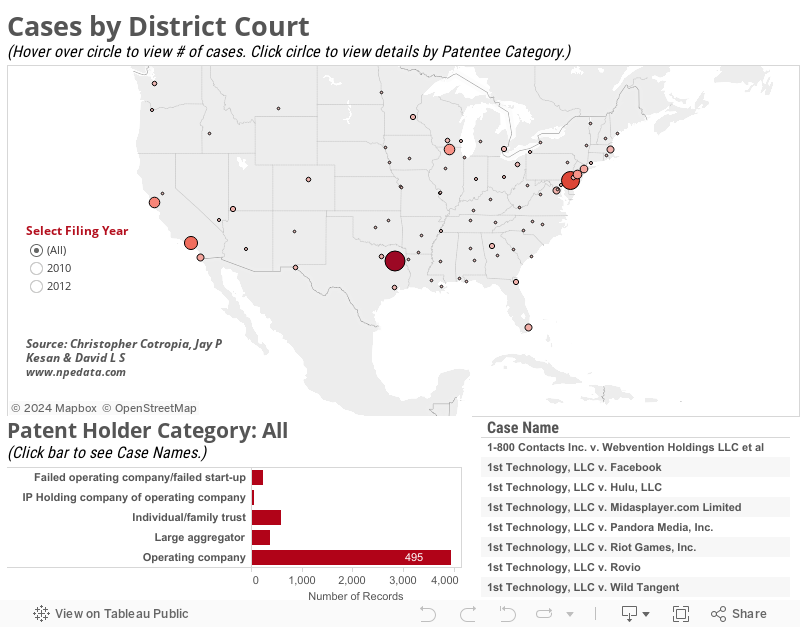
To use the attached dashboard, simple filter by the year you would like to see. Hover over a circle (a “mark”, in Tableau-speak) to view raw statistics, or click the mark to see a filtered list of the number of suits by patent holder category. Finally, clicking on any bar in the category view will filter a list of the actual cases.