Quora Question: ‘What Data Viz/Dashboard Software Should I Use?’

Last week, a user on Quora asked a question about which data visualization platform he should use. I decided to take a little time to provide a detailed answer. The Question What Data Viz/Dashboard Software Should I Use? I’m looking for a software or service that lets me do the following: Create graphs and geo […]
A Neutral View of Super Bowl XLIX Visualized in Tableau

Super Bowl XLIX is almost here. In just a few days, the New England Patriots will take on the Seattle Seahawks in Glendale, AZ. Will the Seahawks win their second Super Bowl in a row, which would also be their second Super Bowl victory ever, or will the Patriots win their fourth Super Bowl in […]
Creating calculated fields in Tableau 9.0
Over the last few weeks, we at InterWorks have been putting the Tableau Desktop 9.0 beta through its paces and have already showcased some of the newly introduced features in this blog series. We hope you’ve been enjoying them; today I’ll be talking through one of my favourites. Even though it may not seem like […]
Tableau 9.0 Brings us more connections!
Earlier this week you heard from Kevin, talking about the new user interface enhancements in Tableau Desktop 9. Today, I will be introducing the new data connections that now come as standard within Tableau 9.0 In Tableau Desktop 9.0, there have been some fantastic UI improvements that Tableau have made which every user will notice as […]
10 Questions for Tableau Zen Master Andy Kriebel

I met Tableau Zen Master Andy Kriebel at the first Tableau Customer Conference (2008) at the Edgewater Hotel in Seattle. Andy and I happened to sit next to each other at a meal, and we discovered that we both lived in Atlanta. Later that year, we started the first Tableau User Group in the world […]
Tableau Essentials: Formatting Tips – Labels
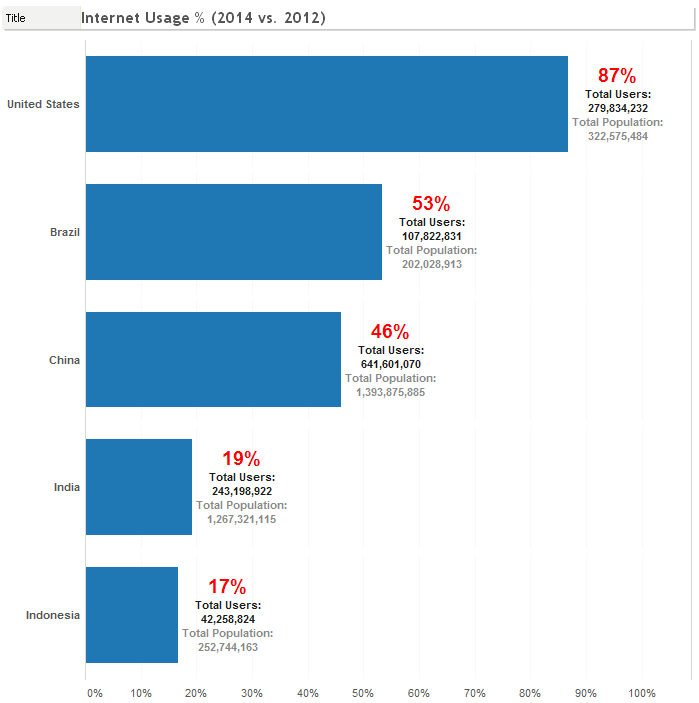
Today, we’re going to cover labels and some of the tricks and tips you can use with your visualization. To start, let’s take a simple horizontal bar chart. Our bar chart shows the penetration of Internet usage of countries with 200 million people or more. Now, let’s click on the Show Mark Labels button in […]
10 Tips to Create a Strong Password Policy
One of the most important aspects of security and data governance is establishing and enforcing a strong password policy. In 2012, LinkedIn had 6.5 million passwords cracked and eHarmony lost another 1.5 million. If 2014 has taught us anything, it’s that hackers and the threat of cyber theft is growing. Sony Pictures was forced to cancel […]
IIS Not Starting with Error 7001: ‘The Data Is Invalid’
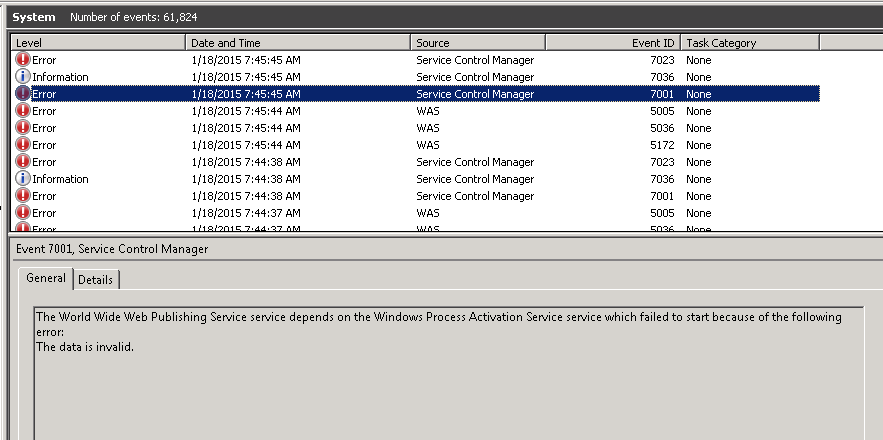
We received notice on a server that the World Wide Web Publishing Service had stopped. This happened to be an Exchange 2010 server, so all webmail functionality stopped. I attempted to start the service manually but received an error that a dependency was unable to start. Reviewing the event logs, I saw that the dependency […]
Tableau Essentials: Formatting Tips – Custom Shapes
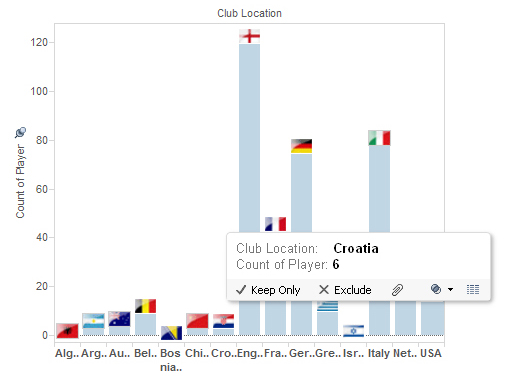
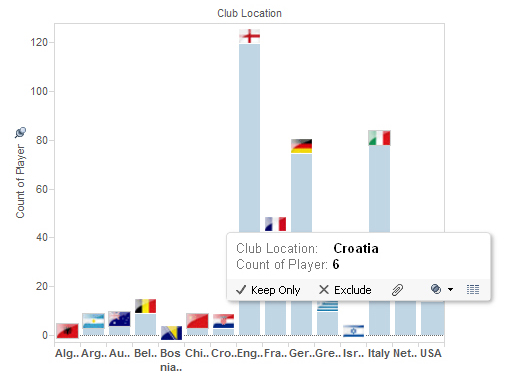
Today, we’ll look at some formatting ideas that you can use on your next visualization. Specifically, we’ll look at using custom shapes to serve as our marks. Here is a simple table illustrating where players from the 2014 World Cup play their club football: Club Location field on the Columns shelf Players field (with aggregation […]
Tableau Essentials: Formatting Tips – Introduction
Now that we have some basics out of the way and a few chart types in our arsenal, it’s time to move onto some of the finer points of data visualization in Tableau. First, let’s talk about formatting. Most of us know the saying, “don’t judge a book by its cover,” but that couldn’t be […]
