What I Did in September – TC14 Plus a Few Other Things

Blogging was impossible for me immediately following the 2014 Tableau Conference. I left Seattle on the Friday morning of conference week and spent the next day in Portland doing some consulting work. Notably, our client picked me up in a Tesla Model S (Tableau clients do well). I returned home late on the Saturday afternoon following […]
Fun with Finances in Tableau: Stepping Up My Game with Action Filters
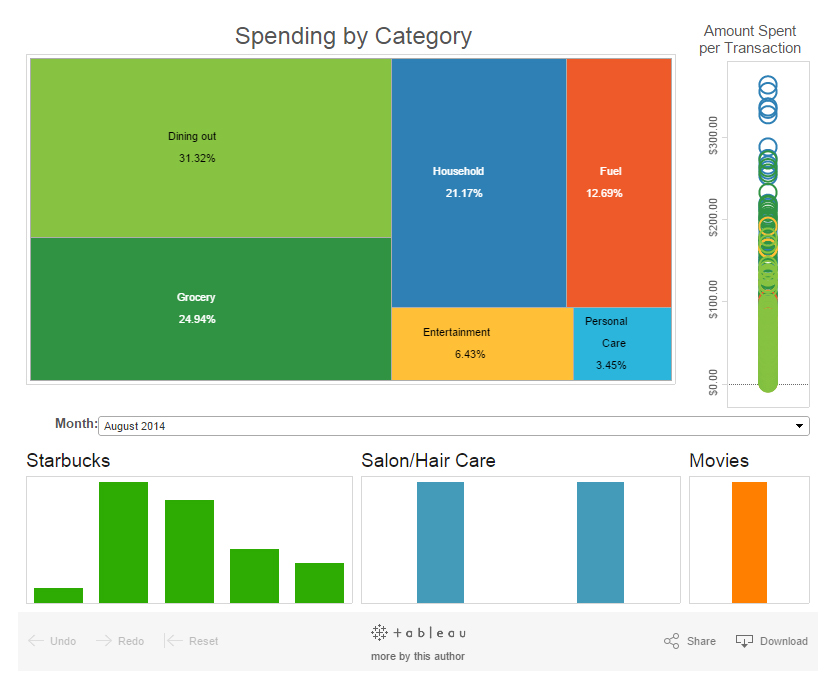
Last time out, I created a very simple and straightforward dashboard based on my family’s finances up to this point in the year. You can find that original dashboard here. While I’m all about making things less complicated than they need to be, I thought it might be fun to it up a notch and […]
A Brief History of Graphs
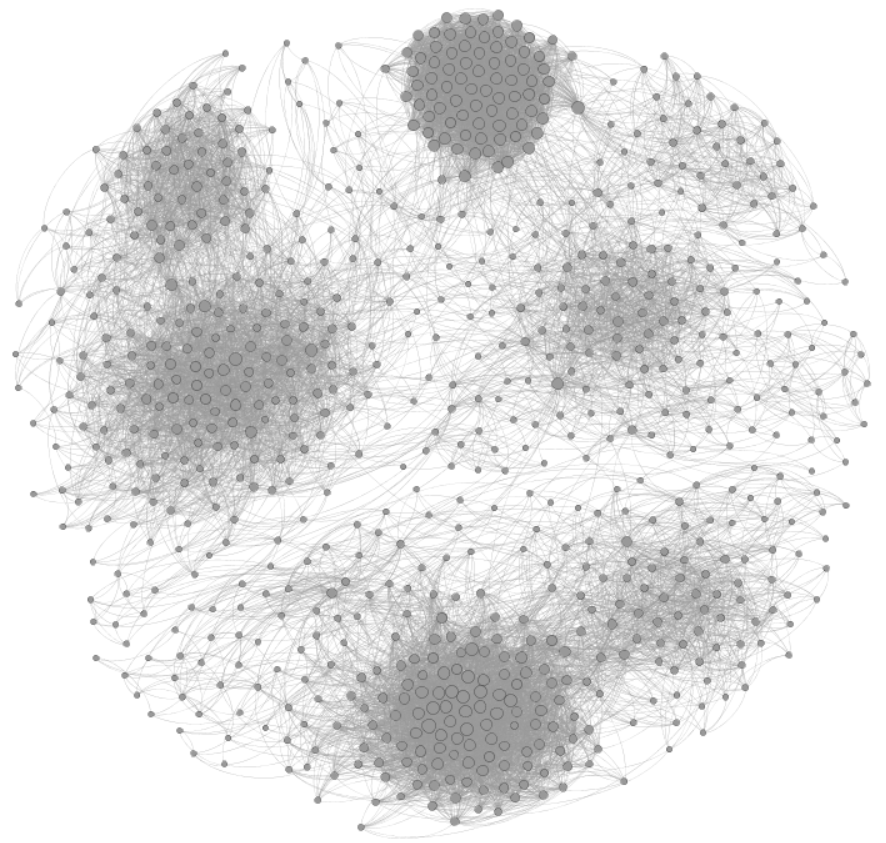
Next week, there is a little conference going on in the great city of San Francisco called Graph Connect. Graph Connect is the only conference of its kind. It’s a conference that focuses solely on the world of graph databases and applications, featuring the leading graph database, Neo4j. In honor of this conference and my […]
Windows Search Not Working in Windows Server 2012 and Windows 8
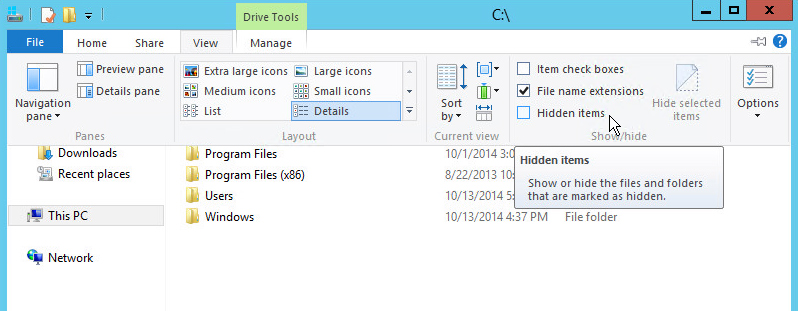
Setup I recently ran into this problem when deploying templates of Windows Server 2012 inside of VMware. The template machine had been pre-configured by another engineer that made use of Windows Search during setup under the local Administrator account. When sysprepping the image, we utilized a profile copy command in order to copy our profile setup […]
Tableau Essentials: Chart Types – Circle View
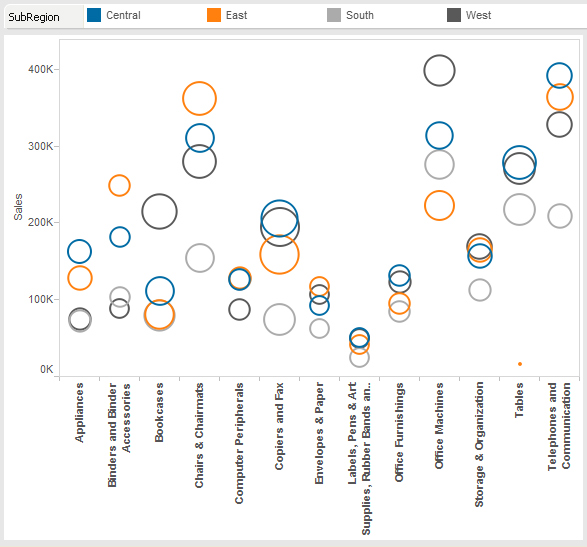
The circle view is another powerful visualization for comparative analysis. The example below in Figure 1 has quite a bit of information packed into a single visualization. First, you can see that we are examining the sales figures for each product category. Take a look at the key on the top of the chart. The […]
Robocopy All the Things
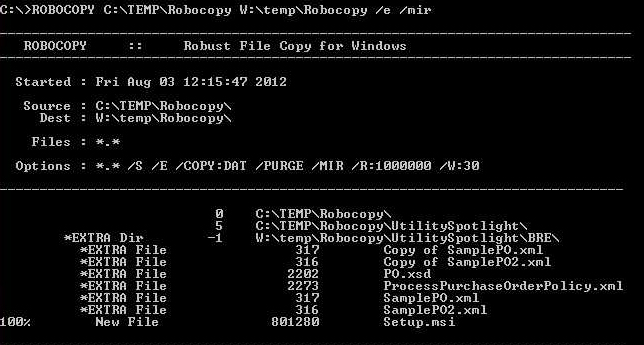
I’m putting this here as a reference for myself and anyone else that frequently uses Robocopy. The following Robocopy command is my go to for most cases. If you don’t use Robocopy, I highly recommend it as the command line tool to automate file copy/sync jobs either locally or across the network between Windows machines. […]
Every Pitch of the 2014 MLB Season Visualized in Tableau
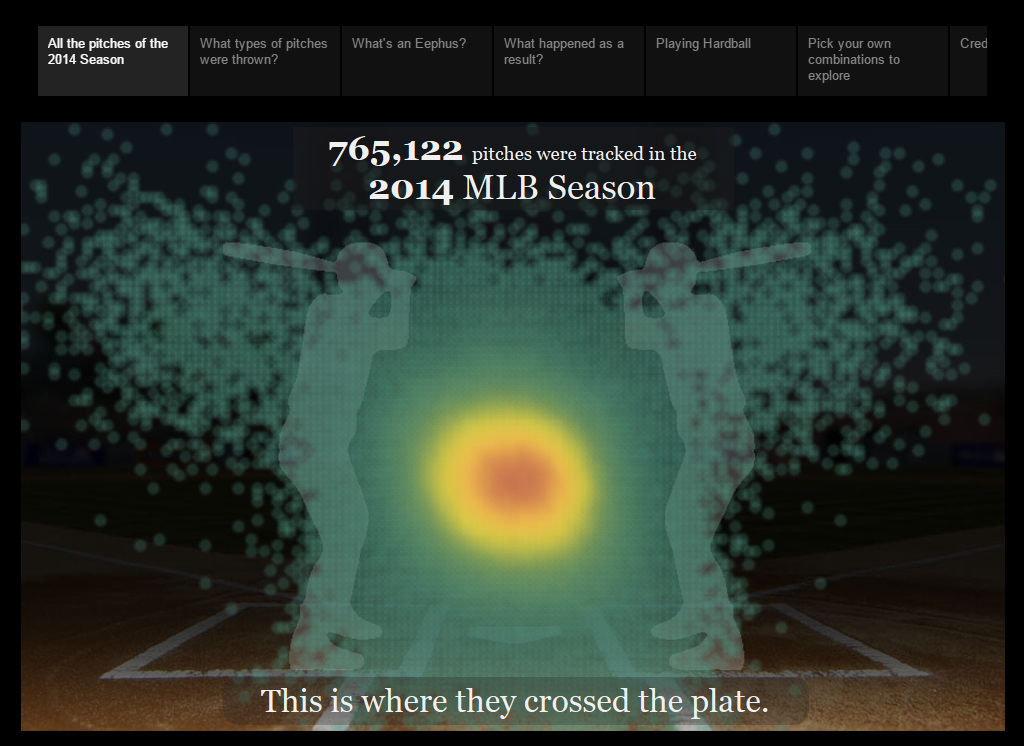
As a data geek, it’s hard not to be drawn in by a sport like Major League Baseball with such rich statistics readily available. I wasn’t very interested in the game until I discovered how simple it is to collect and analyze data on every player, pitch and play. This dashboard is the result of […]
Tableau Essentials: Chart Types – Treemap
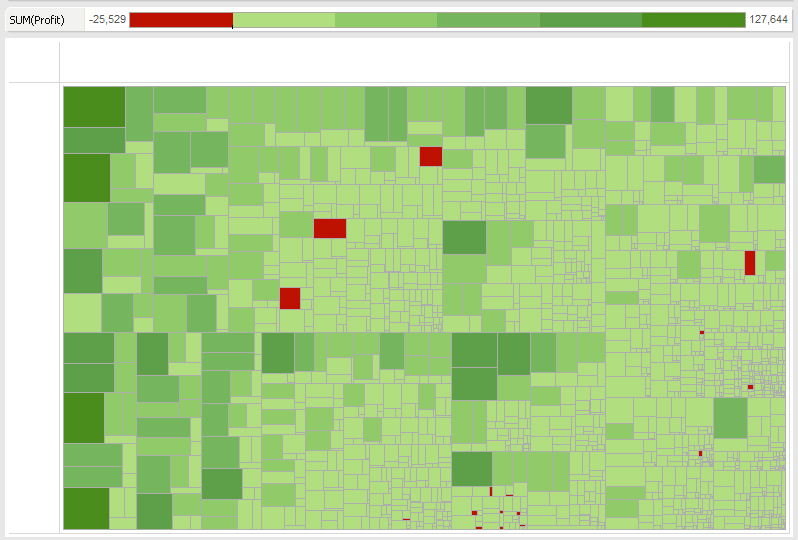
Treemaps are a relatively new feature to Tableau, first appearing in version 8.0. They are very powerful visualizations, particularly for illustrating hierarchical (tree-structured) data and part-to-whole relationships. Because of their visual nature, treemapping is ideal for legibly showing hundreds or even thousands of items in a single visualization simultaneously. Figure 1: Treemap. The example provided […]
The 2014-2015 NHL Schedule Visualized in Tableau
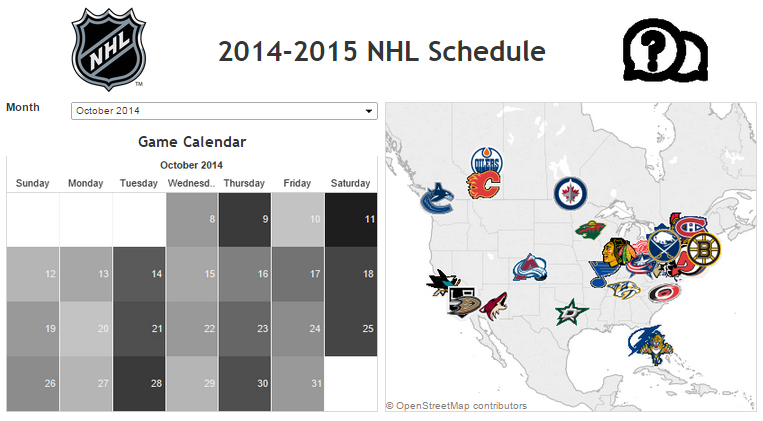
It’s that time of year again. The days are getting shorter, the weather is getting cooler and the end of Daylight Savings Time is right around the corner. Essentially, for people like me, life is going to suck until summer comes back around. But, there is something to look forward to during the season of […]
Fun with Finances in Tableau: I Go to Starbucks Way too Often
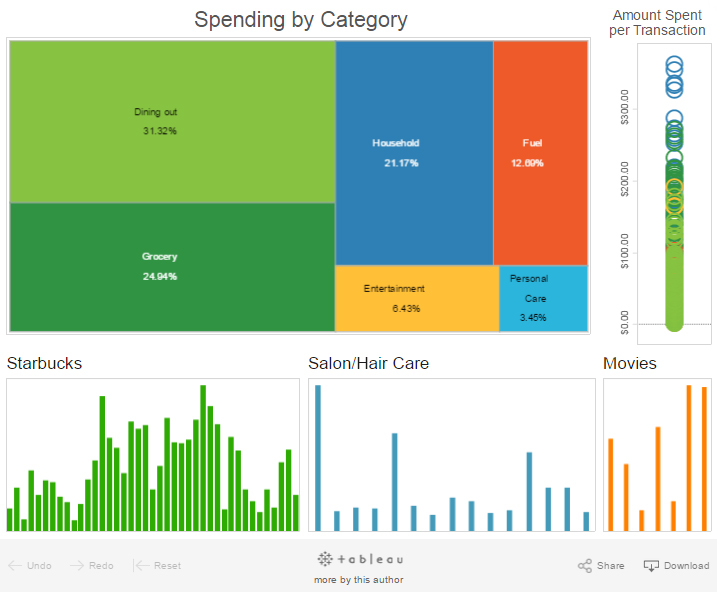
Because I have just that much free time, I thought I’d take a gander at my spending so far this year using Tableau. The holiday shopping season is coming up, and I wanted to know if I would have any money left to fill stockings with something other than the lumps of coal my wayward […]
