Introduction – Why DataGravity? | Discovery Series Part 1
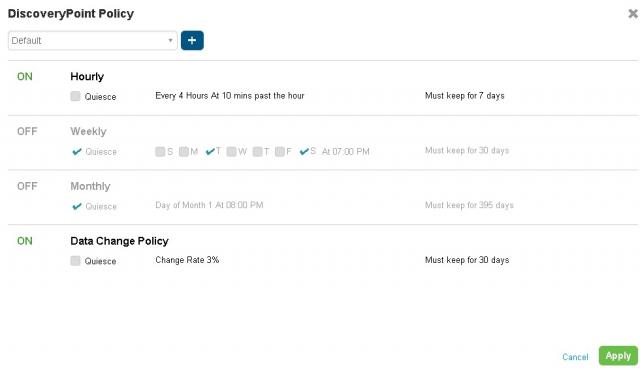
DataGravity – Discovery – Where It Started for InterWorks? In my role at InterWorks I help with technology direction, and given that, I receive a ton of attention from technology vendors eager to show me why their solutions are better. I source some new technologies, attend conferences, receive inbound calls and have talked with nearly […]
InterWorks’ Ideen Jahanshahi Named ‘The Best Veeam Engineer in the World, 2014’

InterWorks’ very own Systems Engineer, Ideen Jahanshahi was named “The Best Veeam Engineer in the World, 2014” last month. The title sounds lofty, but it comes directly from Veeam themselves. What’s more is that he earned it by competing against several of the industry’s best in Veeam’s LAB WARZ at the VeeamON conference. The prize? […]
Creating Multi-State Buttons in Tableau
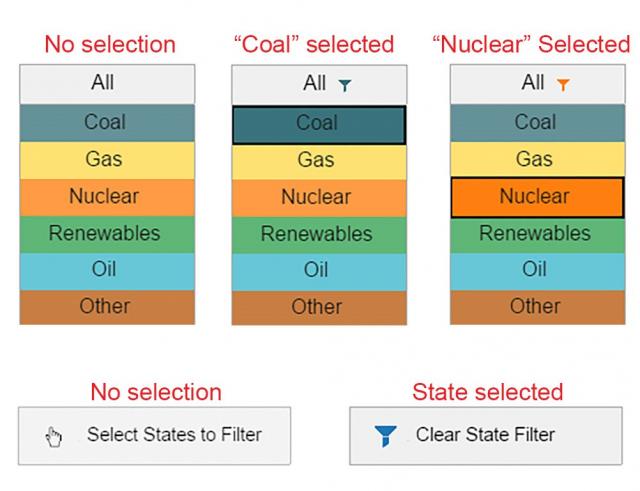
If you follow Tableau blogs frequently, you have likely seen dashboards that have icon-based navigation elements. In this post, we’ll walk through how to take that a step further by creating buttons that will change color and text depending on the state of other selections in the dashboard. Below is an example from one of […]
InterWorks and DataGravity Team Up to Bring Data-Aware Storage to the Masses

InterWorks is excited to announce a new partnership with buzz-worthy enterprise storage vendor, DataGravity. We join the DataGravity partner family as an Elite Partner and reseller. This partnership comes as no surprise given our dedication to delivering state-of-the-art IT and data solutions. “We’re excited to join forces with a company like DataGravity because they’re tapping […]
3 Way Venn in Tableau Upgrade
This post is an upgrade to my original 3 Way Venn post, or at least is a better alternative as it gives the right numbers loads faster and is easier to make! This method doesn’t use sets or anything complicated within Tableau but rather it uses a self join on the data tables. I am using […]
Tableau Essentials: Chart Types – Line Charts (Continuous & Discrete)
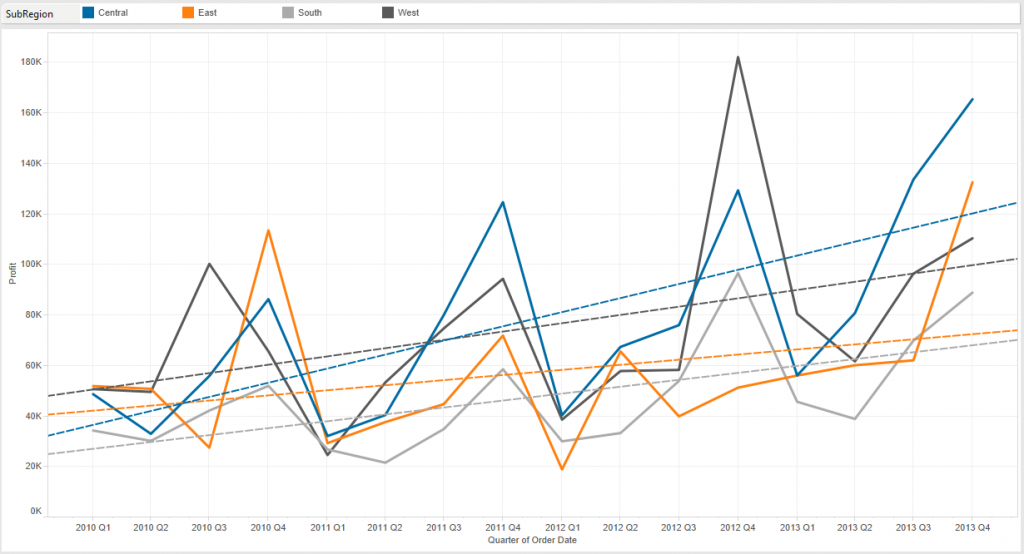
The line chart is ideal for when you want to illustrate trends over time. To use the line chart, you must have a date field. In the below example (Figure 1), we are comparing the quarterly profit by SubRegion over the course of several years. Each colored line represents a different sales region. Figure […]
Tableau Viz: Reddit Watches Peyton Manning Make History
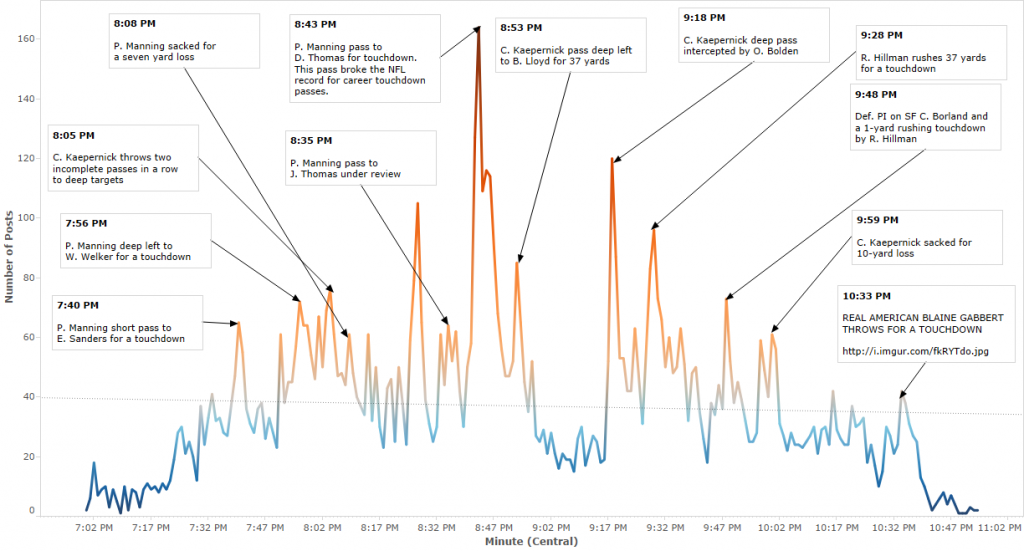
For those of us who cannot live without both the internet and NFL football, Sunday afternoons no longer involve staring at just one screen. The television is dedicated to the game, my phone is dedicated to fantasy football and my laptop is for Reddit game threads on r/nfl. Reddit has a thriving football community that […]
Market Segmentation Using Tableau and R – An Example in Baseball
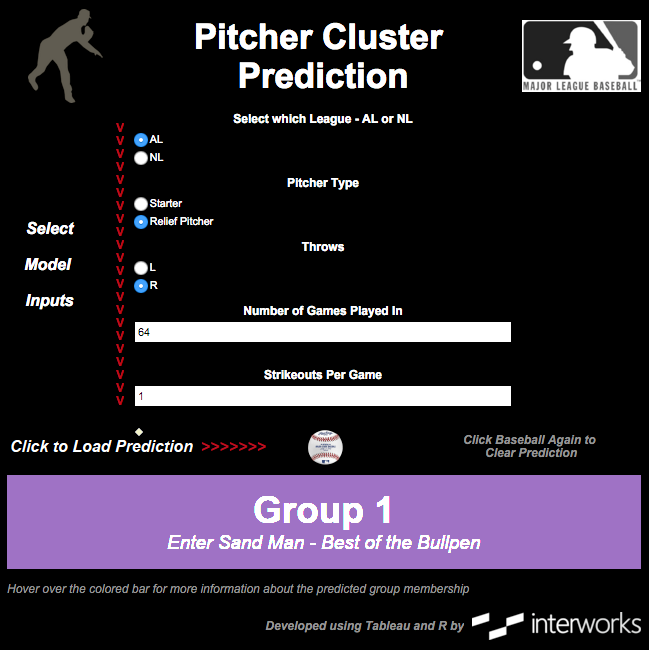
Does your organization use data to better inform its marketing? Have you heard the words “segmentation” or “micro-targeting” thrown around and don’t quite understand what it means? In the spirit of the World Series, I give you an example of customer segmentation using baseball. The goal here is going to be two-fold: Use data from […]
A Look Back at the 2014 Ruckus Big Dogs Conference

Keith Johnson and I just finished wrapping up the 2014 Ruckus Big Dogs Conference two weeks ago, and it was a doozy. Some of you might remember last year’s conference in sunny Miami. Ruckus Wireless came through again this year with another dynamite location: Las Vegas. This was our second conference to attend, and it […]
Tableau Essentials: Chart Types – Side-by-Side Circle View
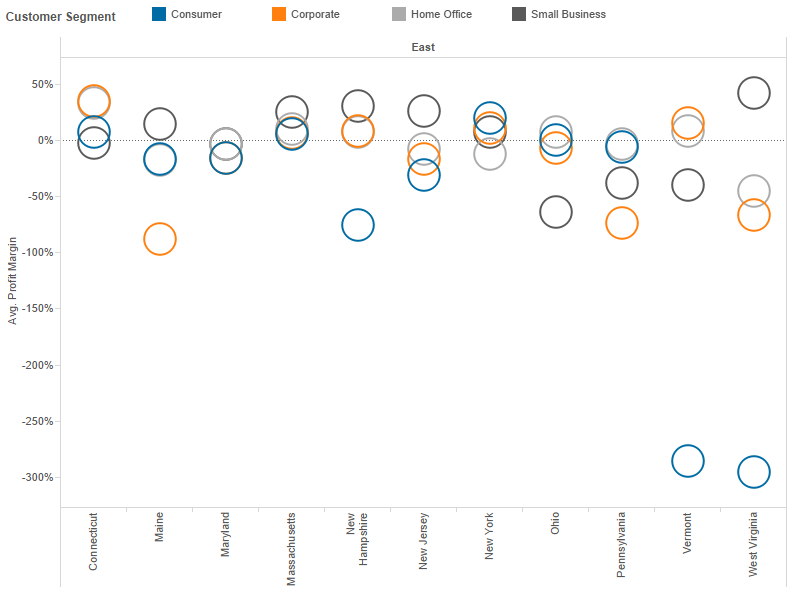
The side-by-side circle view is a variant of the circle view. The side-by-side circle allows you to add more measures to be compared next to each other for a richer analysis. To examine the side-by-side circle view, let’s take a hypothetical retail company and use our visualizations to conduct an analysis. In the circle view […]
