
Blogging was impossible for me immediately following the 2014 Tableau Conference. I left Seattle on the Friday morning of conference week and spent the next day in Portland doing some consulting work. Notably, our client picked me up in a Tesla Model S (Tableau clients do well).
I returned home late on the Saturday afternoon following the conference, and the next two weeks included a six-city tour for Tableau called “Building Data Driven Organization.” This series reached-out to new users and had stops in Phoenix, Santa Clara, Denver, Calgary, Los Angeles and Las Vegas. Amazingly, the Calgary event had over 120 attendees. They were overflowing into the hallway. The average attendance was around 75 people for each event, with the smallest one (Las Vegas) bringing in about 55 people.
After finishing the last stop in Las Vegas, I took a redeye back to Atlanta and did a half-day event at Georgia State University at their Curve Center. The Curve Center has a new digital lab in their campus library. This lab includes a massive 12-panel display comprised of 55”, high-resolution, touch-screen monitors. Here’s an education dashboard that takes advantage of all that screen real estate:
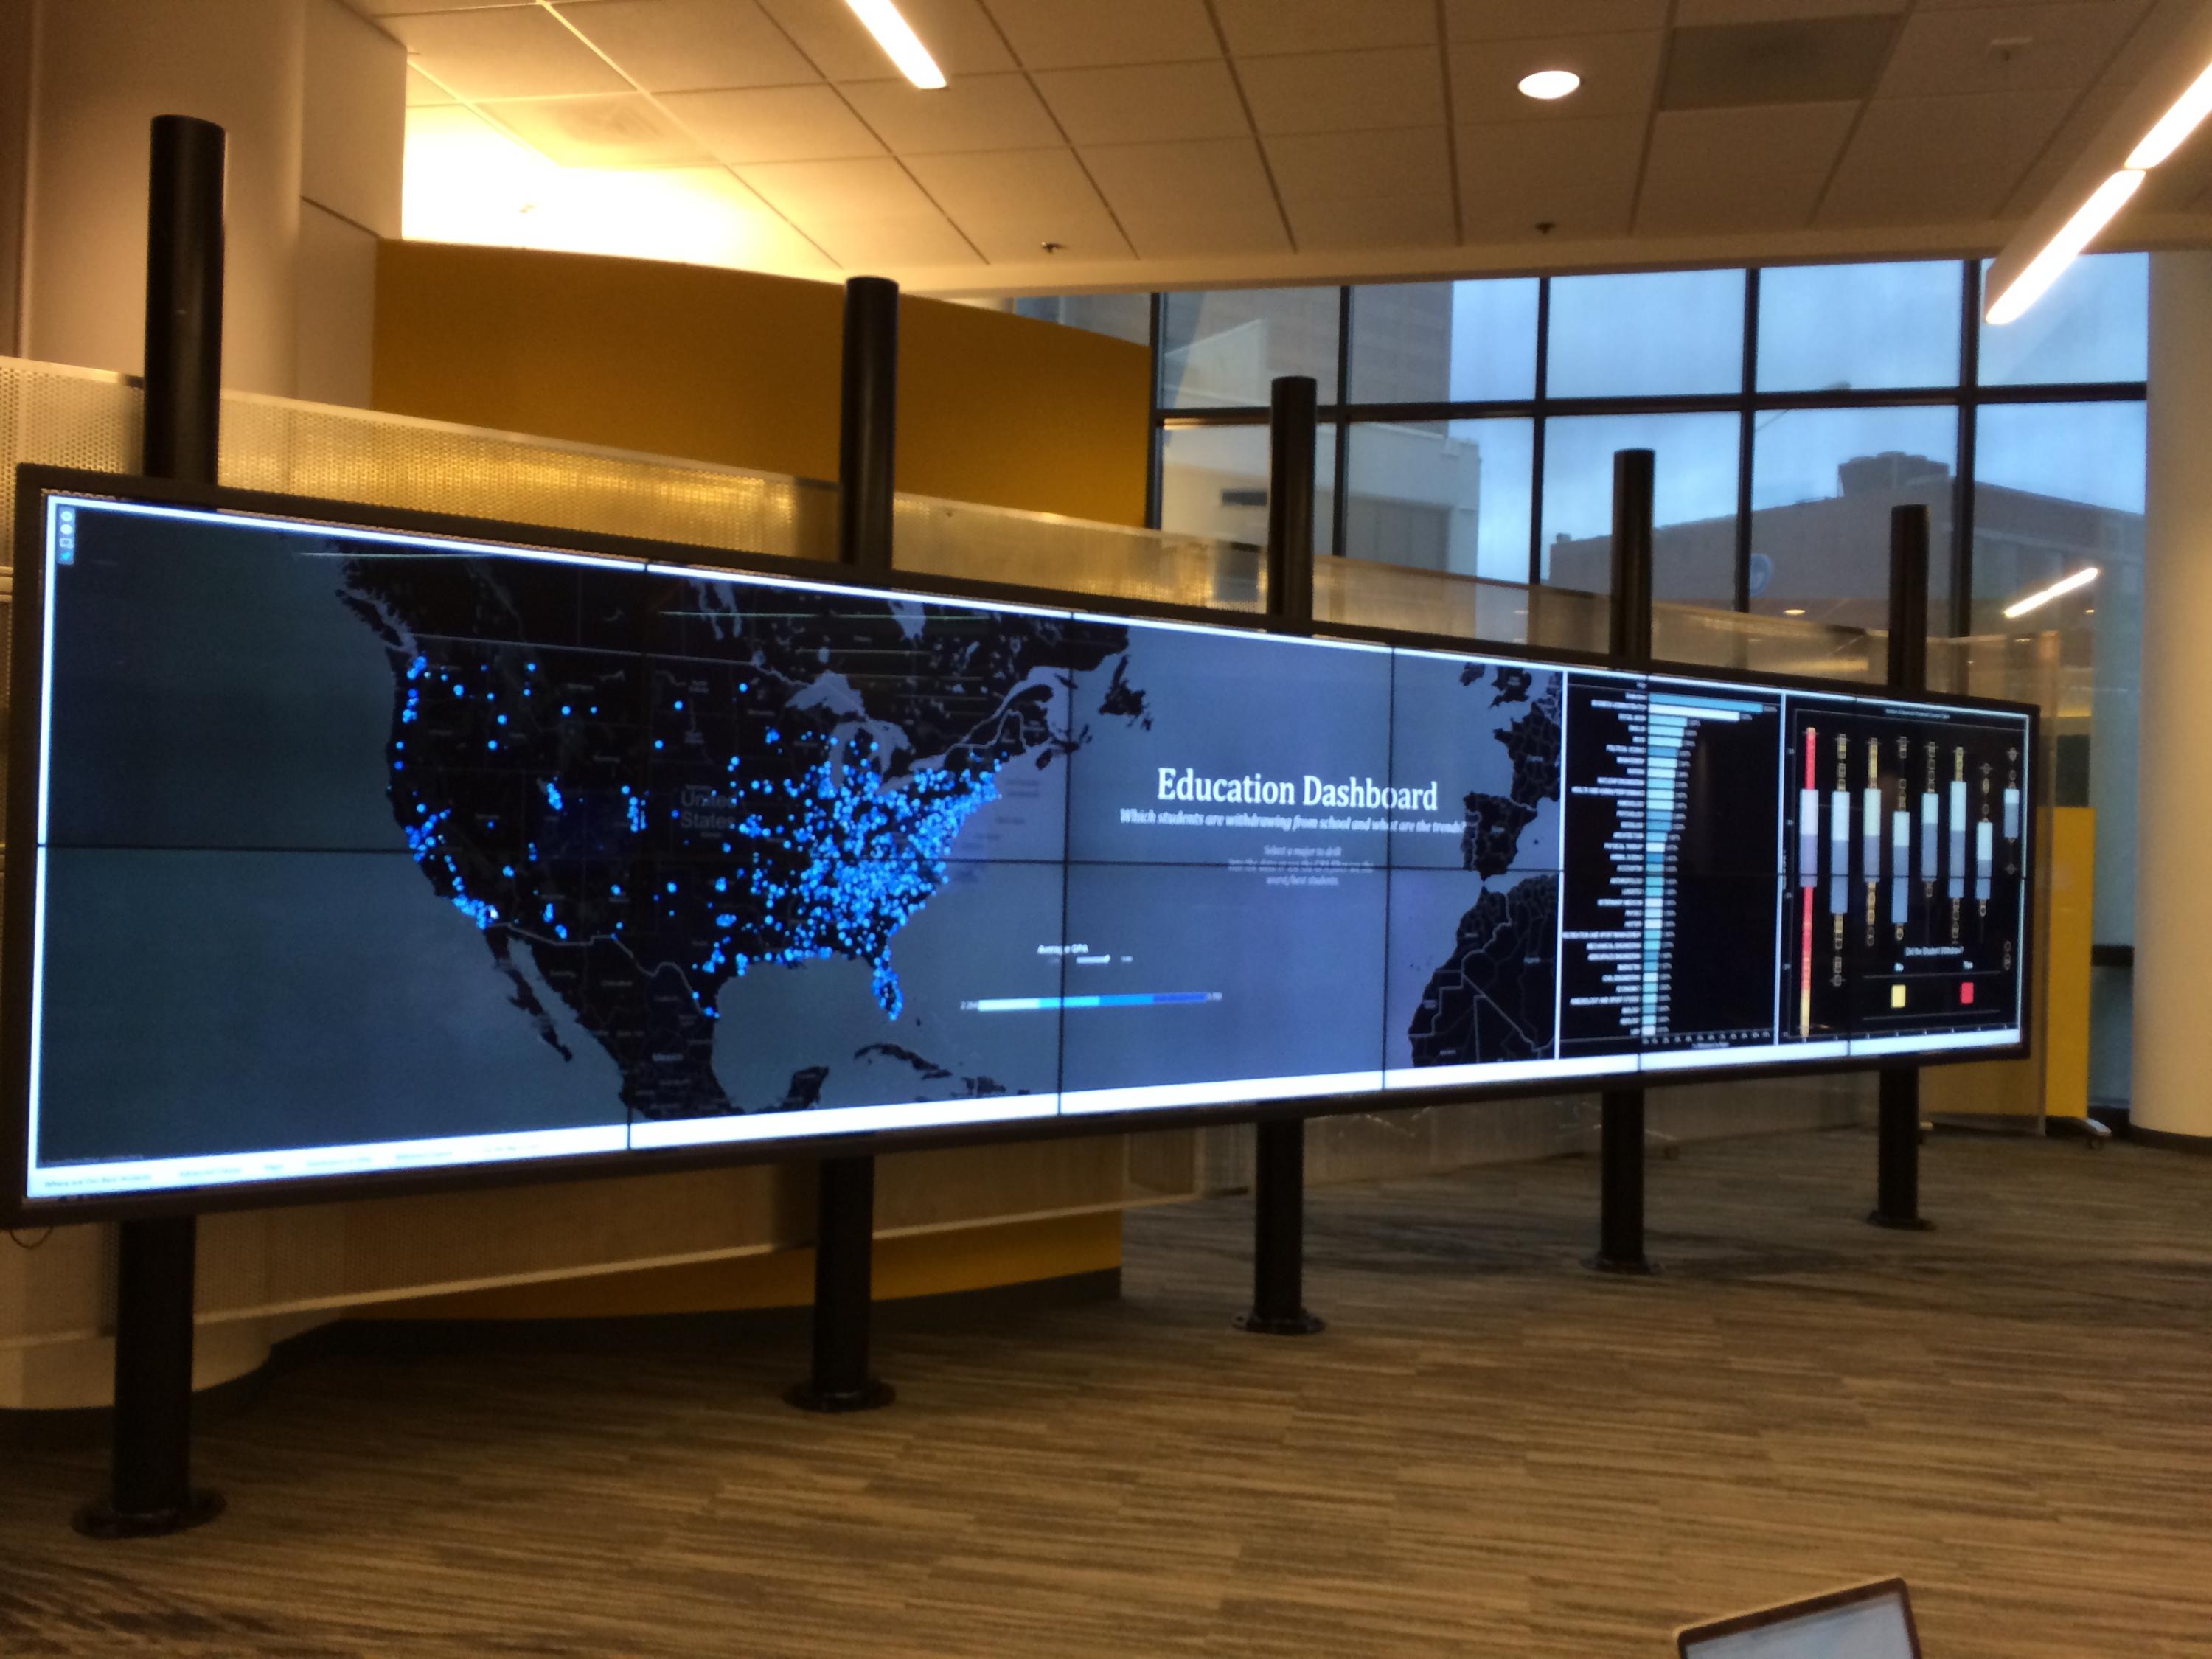
Figure 1: A Tableau dashboard covering 12 55” displays.
Yes, the dashboard contained actions. It was possible to tap a visualization to invoke filter actions or interact with quick filters and see the results. It was a very cool display. Bravo to Georgia State for providing their students with this lab!
But wait a minute, this post is supposed to be about the Tableau Conference in Seattle.
Tableau Conference 2014
It took me a few days to decompress from the show this year. It was massive, brilliant and overwhelming. I recall the first conference seven years ago at the Edgewater Hotel. There were around 150 people in attendance. I had a lot of fun at that event and met some people that became great friends (Andy Kriebel for one). In fact, that meeting with Andy was the trigger that caused us to form the Atlanta Tableau User Group with John Hoover, Andy Piper, Chris Cushman and Martin Click. It was the foundation for the only user group in the world to sprout four Tableau Zen Masters.
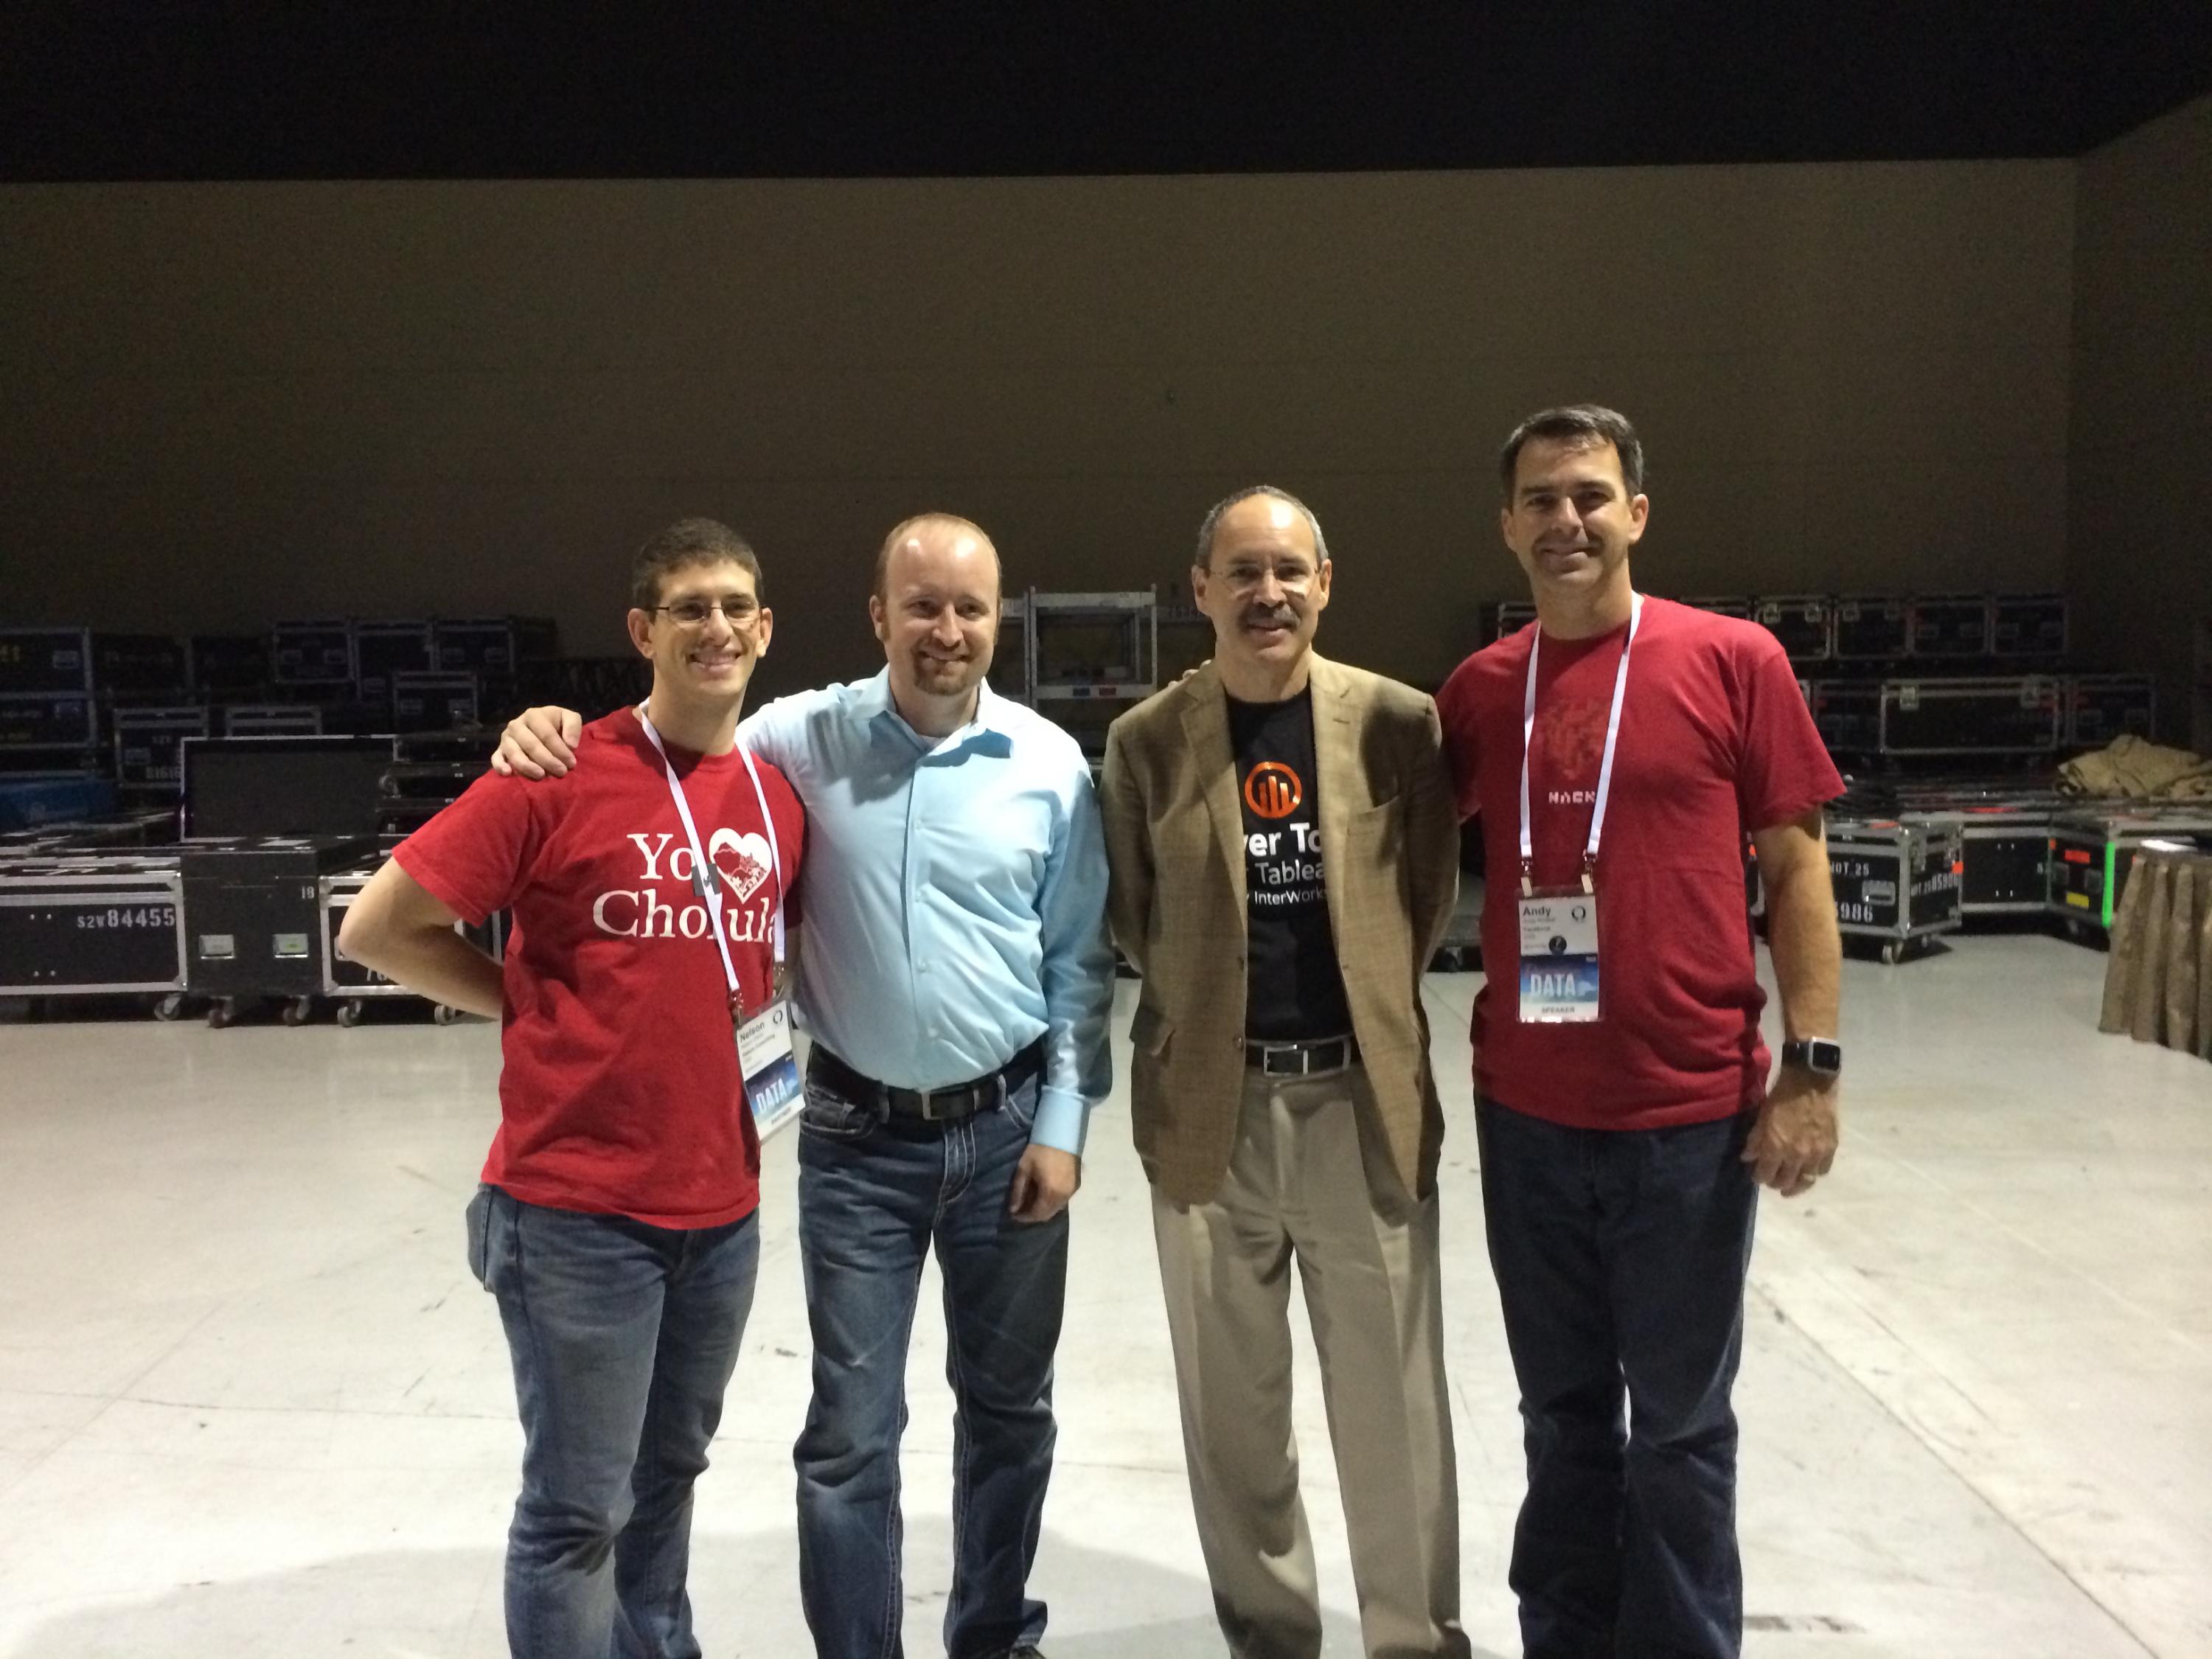
Figure 2: The ATUG Zen Masters from left to right: Nelson, Mark, Dan and Andy.
This year’s show was a huge “event.” Over 7,000 people were in attendance. There was a drone, a Harley Davidson giveaway, a slew of new partners, a massive welcome reception complete with a raucous brass band and many brilliant keynote sessions. I’ll be watching videos of the ones I missed (there were seven to eight sessions every hour) for six months. Overall, this year’s show was an amazing experience. If you missed the fun and learning, you can get your tickets now for next year’s show. TC15 will be at the MGM Grand in Las Vegas on Oct. 19 – 22, 2015.
Getting to the Show
Due to my excessive weekend travel this year, I delayed my arrival in Seattle until Monday.

Figure 3: Your author in front of the Washington State Convention Center.
The Welcome Reception
Tableau welcomed attendees in the proper way with a raucous brass band and some high fives.
Video 1: The welcome experience (brass band).
This was a great arrival to the vendor area, which was packed with new and returning partner booths. We had a crowd in our booth for most of the show.
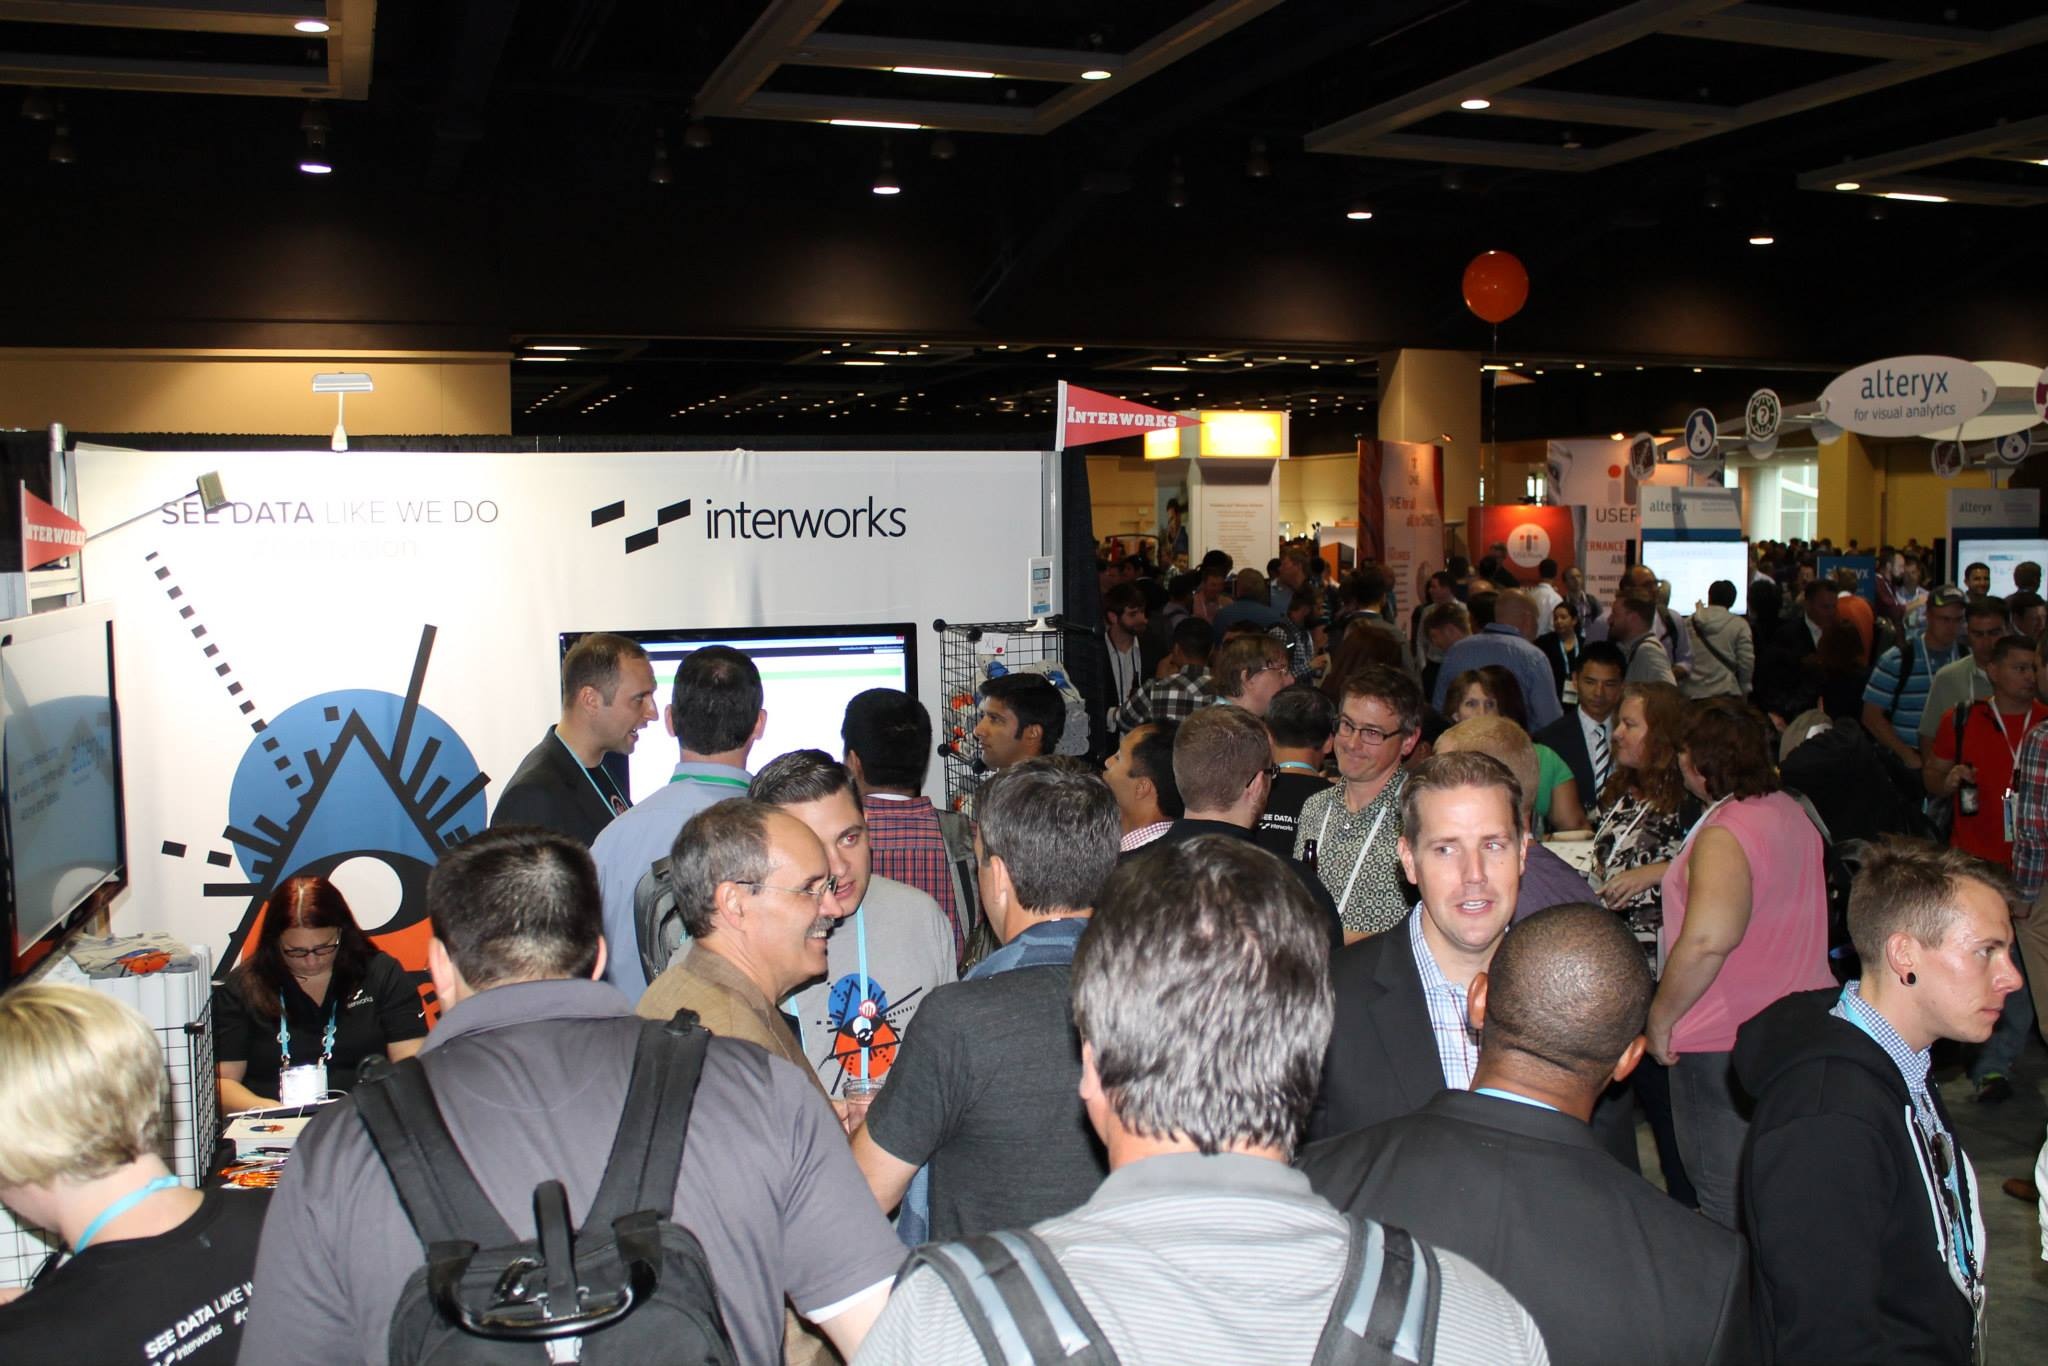
Figure 4: InterWorks’ booth during the welcome reception.
Many of our clients and prospects showed up to say hello. We also had industry luminaries like Mark Madsen, Howard Dresner and Krish Krishan drop in to see what InterWorks’ Power Tools for Tableau were all about.
Christian Chabot Keynote Highlights
Christian Chabot did his typical inspirational introduction to the show by sharing Tableau’s company vision and then introduced an interesting idea: analysis is a creative act. He went on to say that experimentation and expressiveness, both generally recognized as qualities that make for great art, are equally important for data analysis. Christian stated that Tableau’s mission was to make it fast and easy for people to “see and understand” data. To support that mission, Christian sees that facilitating the creative analysis process is critical to unleashing the creative intelligence of Tableau users.

Figure 5: Analysis is a creative process.
He also told the audience that Tableau still has a lot to learn, and Tableau users are one of the best sources for inspiring new ideas in the design of Tableau Software. Christian outlined four key goals for the upcoming releases:
- Encouraging experimentation
- Improving speed
- Enhancing expressiveness
- Providing users with greater control
These are all attributes that help great artists create great art. Most artists create new ideas via experimentation, rapid evolution of ideas and expressing those ideas with a blank canvas. Such a canvas should provide immediate feedback and give the artist the fuel for more evolution that results in a fine artistic achievement.
Christian then introduced Chris Stolte to explain how upcoming releases of Tableau will help users achieve creative results that have value.
Chris Stolte – Supporting the Four Goals & Artistic Expression
Chris introduced a number of new ideas that refine user experience by providing a more flexible and intuitive canvas for creation and exploration of data. Key new features include:
- Type-in fields with autofill
- Freeform calculations
- New analytic side pane in the Dimension shelf
- Improved table calculations
- Additional map search and selection capabilities
Type-In Fields
Chris demonstrated different ways that users can just type in formulas to create new fields and then immediately see the results in the view. Tableau is also adding an autofill feature to complete the selection of fields. This will be particularly helpful to users that are familiar with their data and want to iterate views quickly.
Freeform Calculations
This type-in/autofill feature is also expressed in calculations. They will also be entered directly on shelves while the creator sees the results immediately. A redesigned calculation dialog box also supports autofill and provides a more streamlined view of the results. Again, the focus here is providing feedback in the visualization without having to leave the dialog. Experimentation, control and rapid iteration of ideas are supported with faster feedback.
New Analytics Tab on the Dimension Shelf
This provides another (and more intuitive) way to quickly add trend lines, reference lines and forecasts where the user drags the desired calculation from the analytics shelf to cell, pane or table options. While the current method is easy, I believe this facility will be more obvious to new users and faster for more advanced users.
Table Calculation Improvements
These improvements help new users and even some intermediate Tableau users who have trouble understanding the different types, scopes and directions of table calculations. Tableau is improving visual feedback by providing highlighting of scope via better visual grouping.
Improved Map Search and Selection
Chris ended his portion of the keynote by showing a new map search function that will provide a means for simply typing in a continent, country or other geographic unit and immediately filtering the map to the search criteria entered. This works without the analyst having to add details to the source data merely via the inclusion of address information.
In addition, Chris demonstrated a new radial mark selection tool and a very slick lasso selection tool that allows the user to make very intricate selection of marks that have very random patterns.
Andrew Beers – Improving Speed
As a consultant, I’m always consumed with how to make dashboards load faster, queries execute more quickly and how to ensure that rendering of marks is as fast as it can be. We built a performance analysis tool years ago to aid our client work that Tableau improved and added to the product. You can find it in Tableau Desktop under help/performance analysis.
Andrew’s portion of the talk focused on speed improvements coming to both Tableau Desktop and Server. Key areas covered included:
- Viz Engine improvements
- Multi-core processing
- Vectorized instructions
- Persistent query cache
Viz Engine Improvements
Tableau’s visualization engine will take advantage of new hardware capabilities, use improved algorithms for speeding up tooltip rendering and enable parallel processing of queries. This is a big deal. If you have a dashboard that requires 10 queries to launch and return results, each requiring an average of two seconds, your dashboard can’t load faster than 20 seconds. This is because Tableau currently executes these queries serially.
In the next major release, Tableau will be able to execute the queries in parallel. This new capability means that the aforementioned queries would be completed, and the dashboard would load in two seconds versus 20 seconds. That implies a 10X improvement. Andrew cited test results that were not quite that spectacular, but they’ve dramatically improved (3X to 4X).
Multi-Core Hardware and Vectorized Instructions
Tableau is going to take advantage of new hardware by fully utilizing the available hardware. For example, if you are using a MacBook Pro with a four-core processor, Tableau will be able to split the workload intelligently among all four cores. This greatly improves speed. Vectorized instructions give Tableau programmers the ability to direct the work to available resources dynamically.
Tableau Server – Persistent Query Cache
If you have a lot of server users consuming Tableau dashboards, this one will make you smile. Tableau Server will cache queries created by one information consumer so that all subsequent information consumers benefit from the initial query. What this means is that the first time a user selects a particular filter will be the slowest performance. Every subsequent user will have the benefit of the earlier user’s query because Tableau Server will cache that query result. So, the second time a query launches will be from a cached, pre-calculated answer.
This makes me think of Tableau as a newer/better data cube. The popular questions will be cached via popular demand. The less popular questions will be a little slower, at least for the first time. I think this feature will be a big deal for large companies that have heavy dashboard usage. Andrew called this feature “persistent query cache” – very clever.
Marc Reuter – Data Preparation Improvements
Most of the time spent analyzing data is actually taken-up “preparing” the data for analysis. Marc’s talk focused on the ways Tableau is going to make it easier to prepare spreadsheet sources for analysis. Key topics included:
- Automatic data modeling
- Splitting
- Unpivoting
- Web service data (REST API, Web Data Connector)
Automatic Data Modeling
This feature provides a fast and easy way to point Tableau at poorly-formatted spreadsheets (multi-level titles, gaps, extra spaces) and get instantly improved formatting that is visible in the Data Connection window. With this feature, you can visually confirm that Tableau correctly formatted the data. That’s just where the fun begins.
Splitting and Unpivoting Columns
While you are navigating in the data displayed at the bottom of the connection workspace, you can select individual columns of data for splitting or unpivoting. For example, your data set might include a single column that looks like this:
Newnan, Georgia 30265-United States
This single column includes city, state, postal code and country, all separated using different delimiters (comma, space, dash). With this new splitting feature, you only need to select the Split option from the column header selector, and Tableau is able to identify the different ways in which the data is delimited and automatically creates four separate columns of data. Very slick!
The Unpivot feature allows you to quickly add a column that identifies a particular dimension (Date for example) and place a fact in its own column. It also adds rows so that the data is stored in a format similar to how a database would store the data. Imagine a sales budget spreadsheet that looks like this:
Description / Jan / Feb / Mar / etc… / Dec / Total
Each month column contains a sales value. By using the Unpivot option, Tableau reformats the data set to look like this:
Description / Date / Amount
Rows are added to reflect year date. In this example, the Date row would be a specific month. This is another big time saver.
Web Service Data via APIs & Connectors
Marc didn’t demonstrate any of these tools, but he told us that the APIs were maturing. He also said that Tableau was excited to see what the customer and partner community would do with them. In our own case at InterWorks, we’ve used the existing APIs to build Power Tools for Tableau as well as iOS and Android applications that allow users to administer and manager Tableau Server from a cell phone. As these APIs mature, more and more functions will be created that exploit the API functions.
Jock Mackinlay – Story Points
A very popular feature release in v8.2 are Story Points. I didn’t really think much of this until I judged a visualization contest at Facebook earlier this year. The contest provided multiple data sets for people to analyze in 60 minutes. Each team was then given 60 seconds to explain their findings. The winning team (three people) were able to articulate a clear answer using Story Points (three presenters with 20 second each). After that, I was a believer in the power of Story Points.
Key new features:
- Controlling font and color
- Reposition and resizing
- Improved linear storytelling
More Control of Story Points Styling
Story Points currently can’t be styled in any way. The next release will allow designers to control font and color. You will also be able to reposition where Story Points appear as well as the size of the Story Points objects. Finally, linear storytelling will be better supported by allowing Story Points to be just numbers appearing in very small Story Points. So, the Story Points might simply be sequential numbers that the information consumer would just select to move through a linear story arc.
François Ajenstat – Server Improvements
François detailed coming enhancements to Tableau Server that included:
- VizPortal
- Improved Security
- Improved Performance at Scale
- More Extensibility in the APIs
VizPortal
This is Tableau’s way of describing an improved user interface and more seamless scrolling for the Tableau Server information consumer. François demonstrated improved graphical displays of large sets of Tableau workbooks.
Improved Security
Tableau will support Kerberos, Smart Cards and improved (more visual) permissions control editing in v9.0. Some of these improvements may make it into v8.3.
Improved Performance at Scale
In general, Tableau is always looking for ways to improve performance on larger and complex data. The aforementioned Persistent Query Cache (described in the Andrew Beers section) is one example.
Ellie Fields – Tableau and the Cloud
Ellie discussed Tableau’s own use of cloud technologies and what Tableau has learned from being a cloud-centric environment. Does all of Tableau’s data reside in the cloud? No. Tableau combines cloud data with an on-premise data warehouse. Tableau is going to be even more cloud-friendly in future releases. Tableau Online already supports cloud-to-cloud communications.
Ellie also showed an example of how Tableau embeds Tableau visualizations and dashboards into Salesforce via their Sparkler toolset. She explained how they can integrate cloud data with on-premise data using an OAuth connection. Her message is that with Tableau, you can put your data anywhere and have it automatically refreshed.
As the next version comes, she expects more capabilities and options to be made available.
Dave Story – Mobile
Dave talked about improvements coming to Tableau’s current mobile products and a completely new tablet product being developed called Project Elastic. Here are the highlights:
- Faster and more powerful
- Better navigation and filtering
- Ability to edit or create calculations
- Ability to use data without an internet connection
- Project Elastic
Through continued performance improvements to the existing mobile application, Dave demonstrated improved speed. The performance improvements will also include improved navigation and filters capability. These aren’t particularly exciting from a glance. If indeed you need better performance in your mobile application, Tableau is working on that.
A more exciting development is the ability to edit or create new calculated values while using your tablet. Additionally, you’ll be able to schedule refreshes to your tablet data that will allow you to use your tablet to analyze your data while you are not online. Such a feature is potentially very useful for traveling staff.
Project Elastic
The most exciting new innovation related to mobile is a totally new product called Elastic. With Elastic you’ll be able to create completely new analyses from data that you have residing on your tablet. That’s right. These are completely new visualizations and dashboards. Dave demonstrated some very cool swipe-enabled filtering along with expanding or contracting hierarchies of dimensions. What Tableau is going to do is bring desktop-like functions to the tablet. That said, they are being very sensitive to the differences between the desktop and the tablet in the design of this new tool.
Keynote Conclusion
As has been Tableau’s track record, they plan to continue seeking advice from their customers and partners to direct their development efforts. Christian Chabot told the audience that Tableau Software will spend more money on research and development in the next two years than the company had spent in its first decade. Based on the glimpse provided into v9.0, I’m excited about the next release already. As a Zen Master, I’ve already received an alpha release to play with. I’m under NDA and can’t discuss details, but I’m happy with what I’ve seen in v9.0 so far.
Neil deGrasse Tyson’s Keynote
Dr. Tyson’s speech was motivational and funny. It covered a wide range of topics, including the possibility of an asteroid colliding with earth (likely), the reclassification of Pluto (see Madeline Trest’s letter below) and examples of bath math.
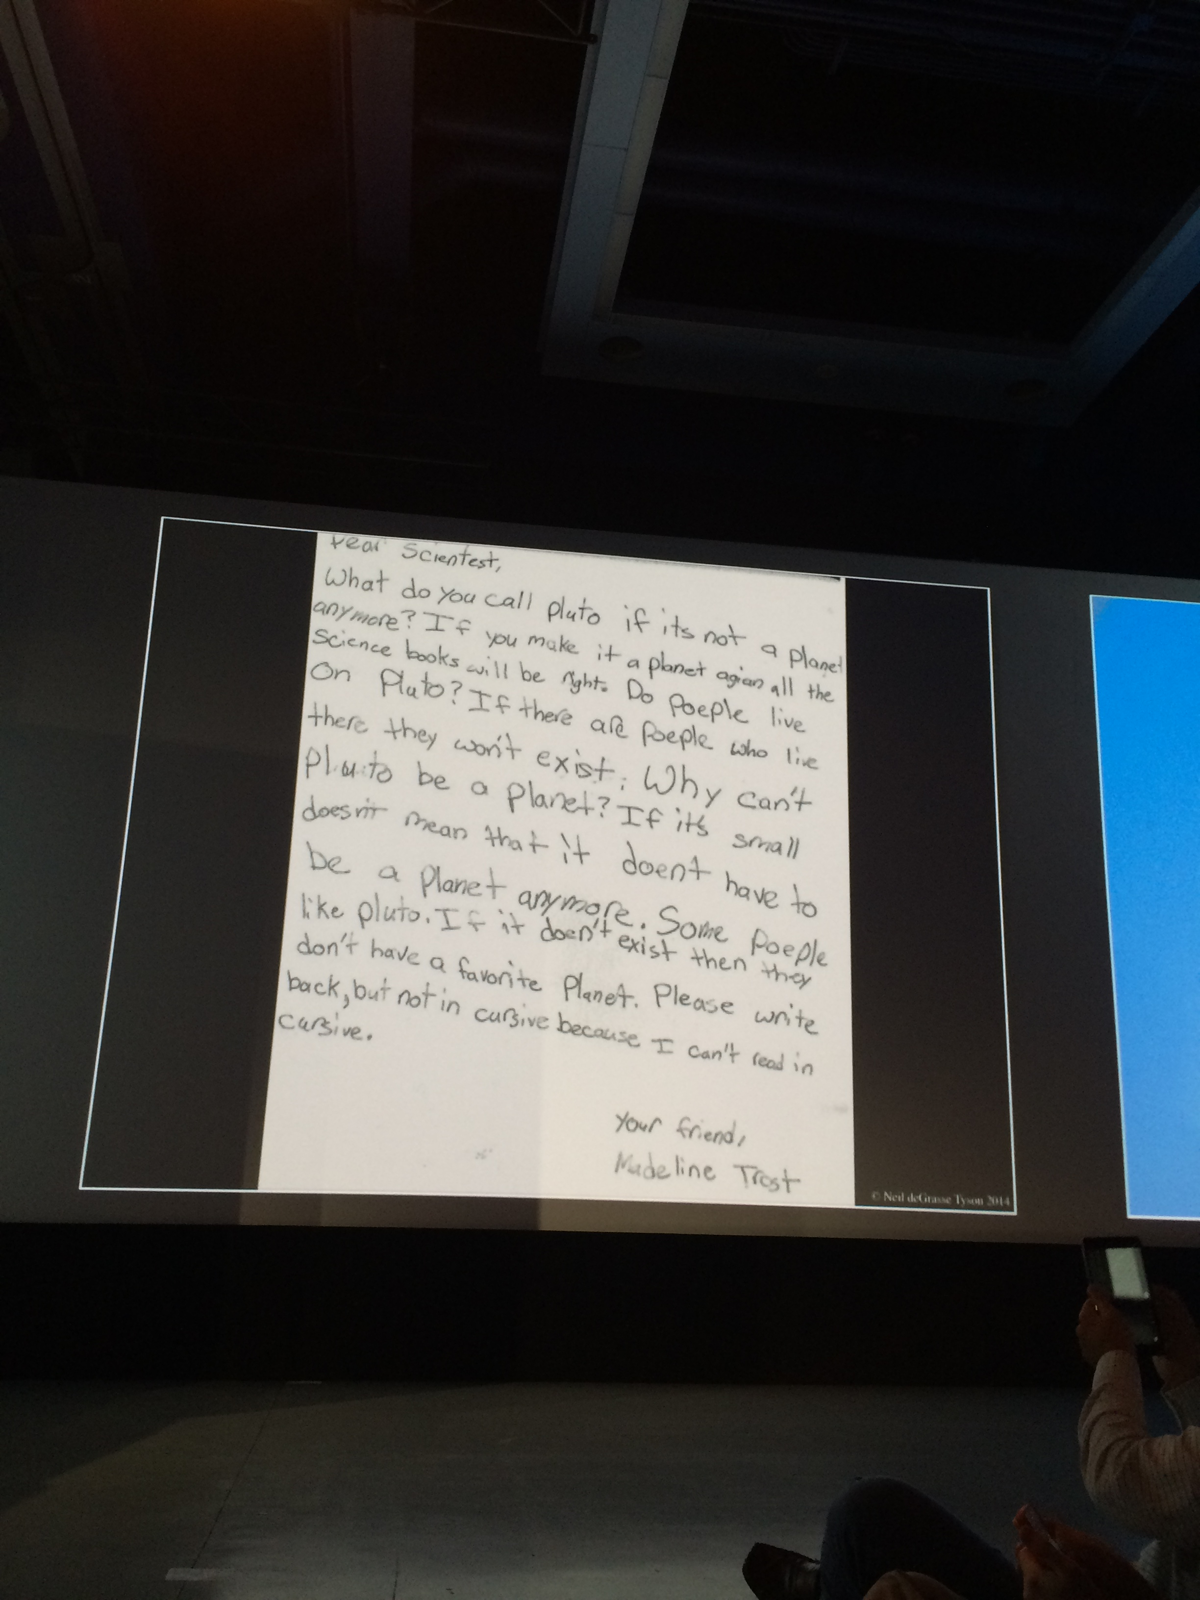
Figure 6: Madeline Trest’s letter image.
Madeline gets to the point. Very funny.
It’s safe to say that Neil deGrasse Tyson infused the audience with very good feelings about learning and the wonder of discovery. That’s a good message for the Tableau crowd of 5,000.
NYSE Closing
Because I work with a bunch of wonderful people at InterWorks, I was honored to receive recognition as a Zen Master this year. I consider this recognition to be the cumulative effort of the entire InterWorks team. Since my name is on the rock and we were one of the first firms to fall in love with Tableau, I received one of the few invitations for a non-Tableau employee to stand on stage with Tableau Software leaders and team members to close the New York Stock Exchange.
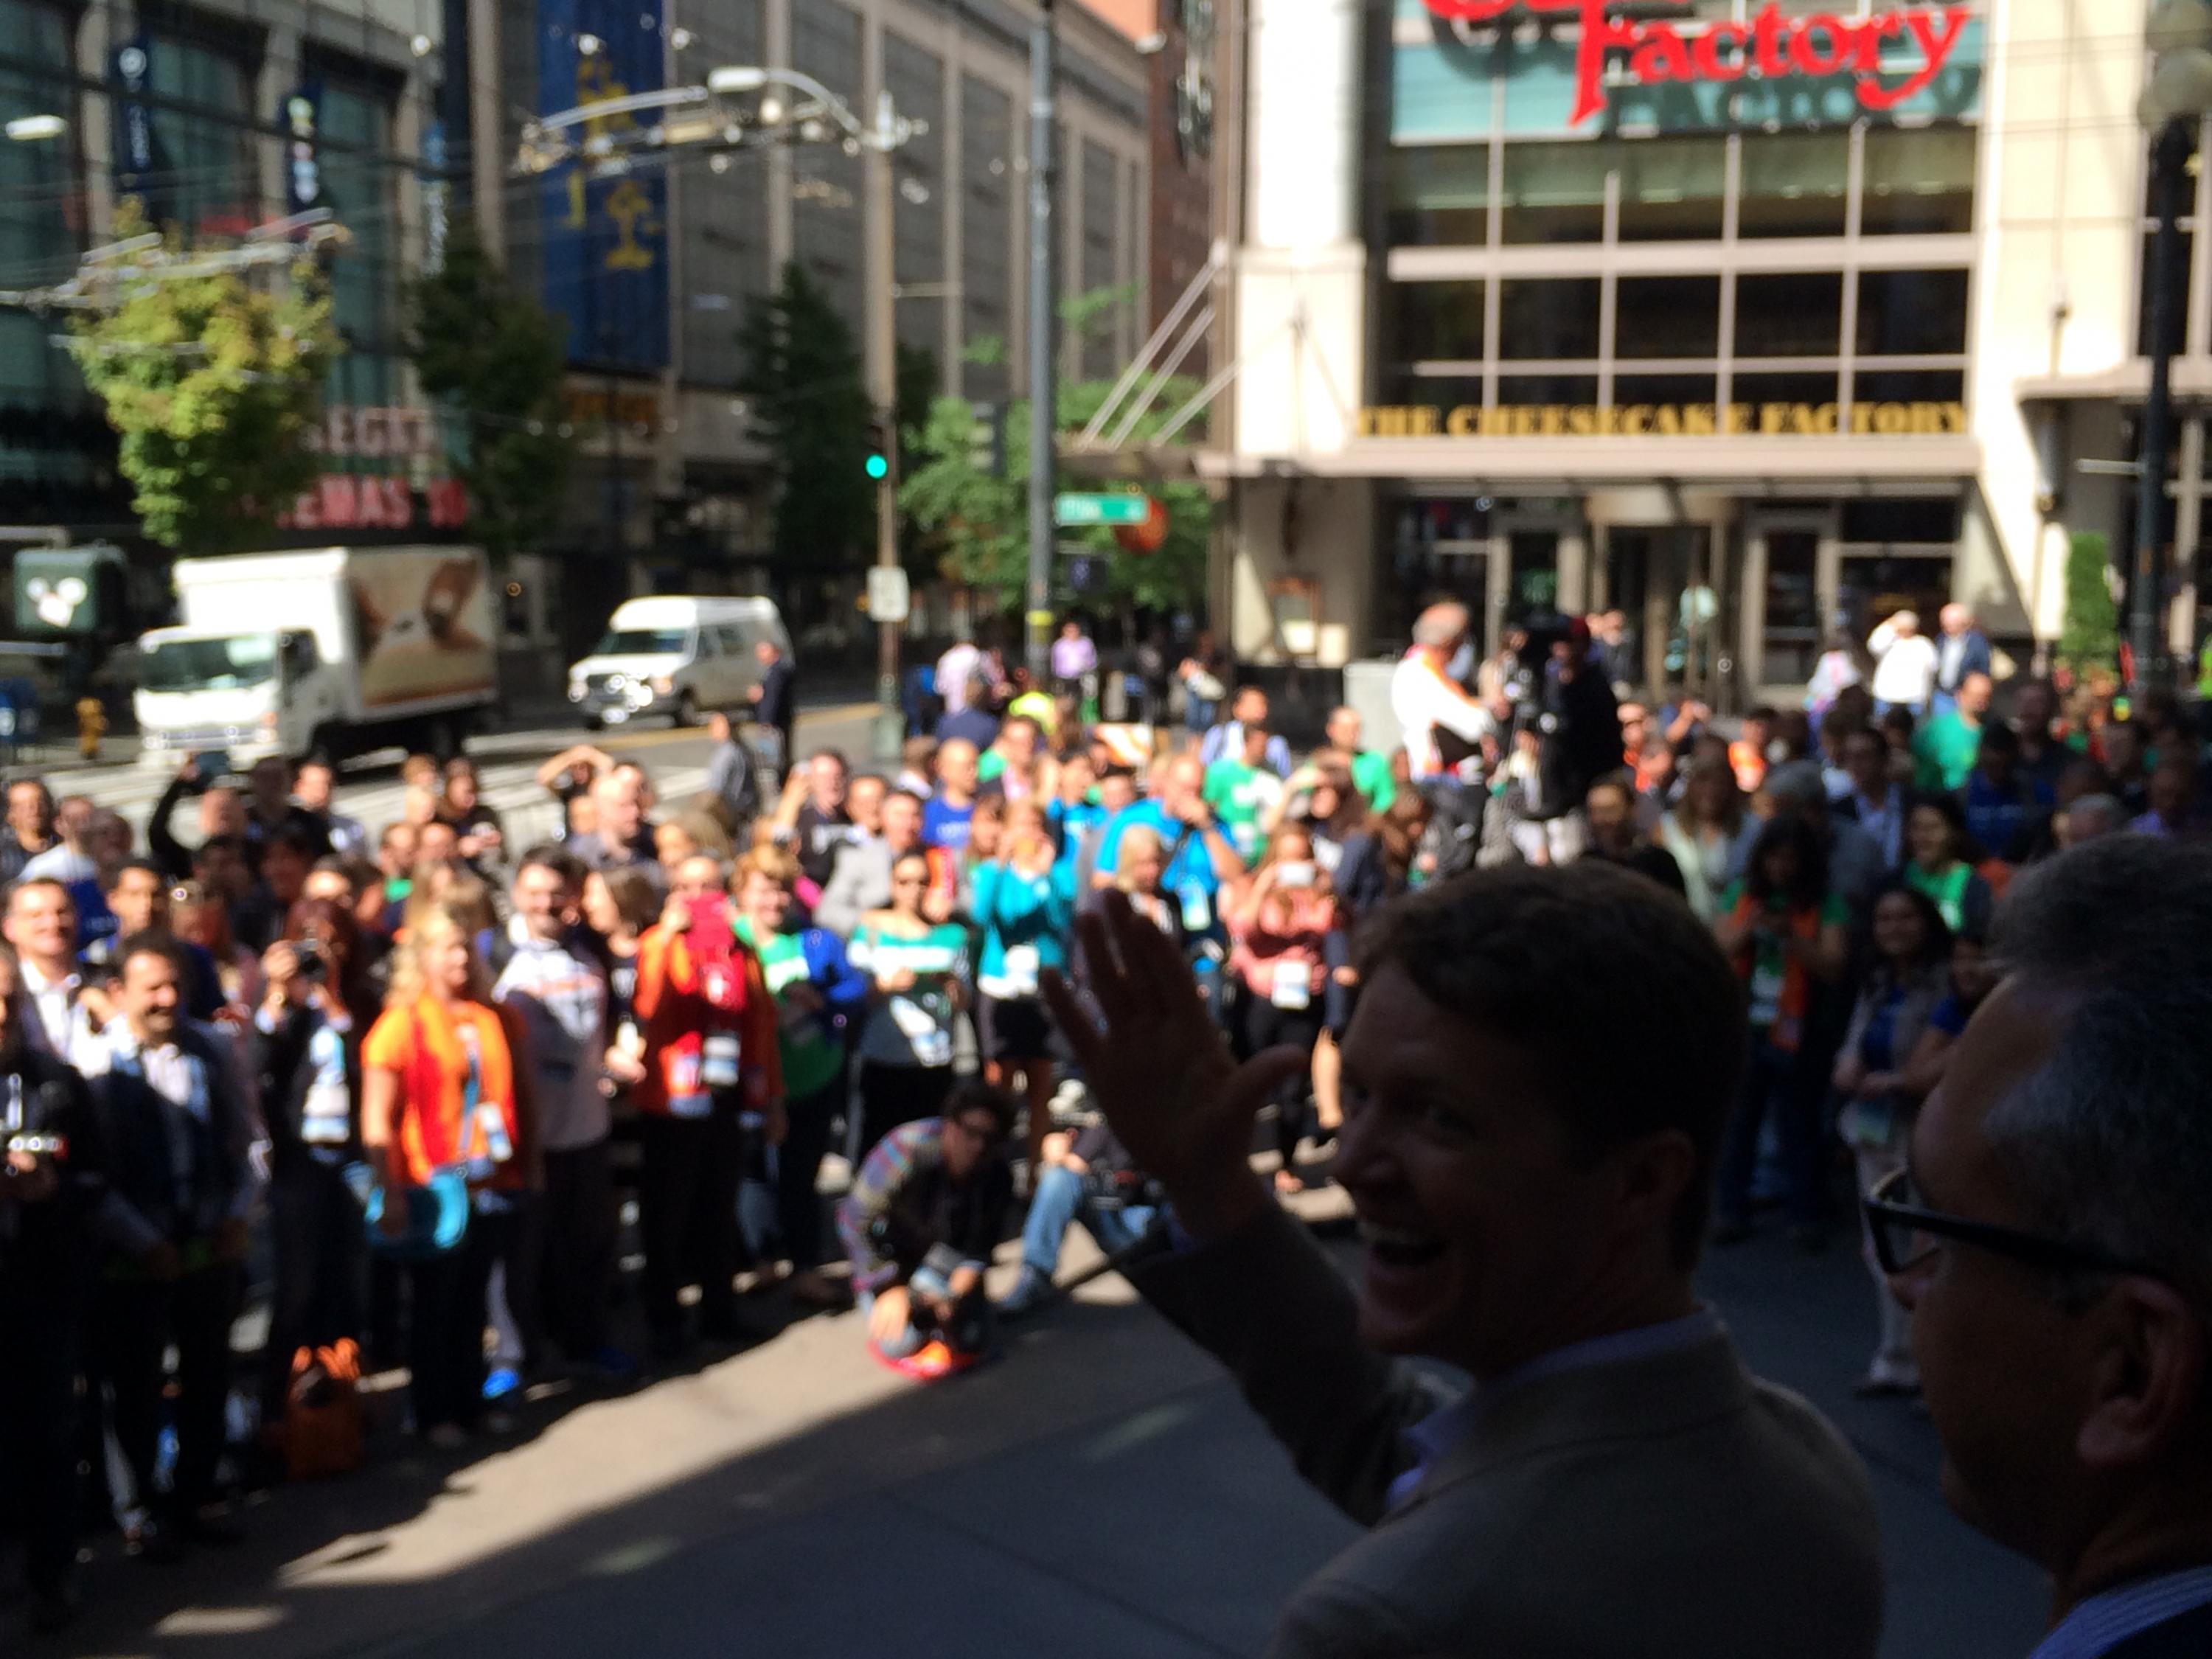
Figure 7: Picture of Christian Chabot closing the NYSE.
It was fitting that my good friend Deepak Ghodke was standing next to me. Deepak was instrumental in our early success. He’s the guy grinning at the end of the video. Without Deepak’s early support, there would be no InterWorks.
Video 2: Closing the NYSE – The view from behind Christian Chabot.
Facebook Kills It – Andy and Bryan Play Tableau Jeopardy
My favorite breakout session (I wasn’t able to attend many) was the entertaining and informative session put on by Andy Kriebel and Bryan Brandow of Facebook.
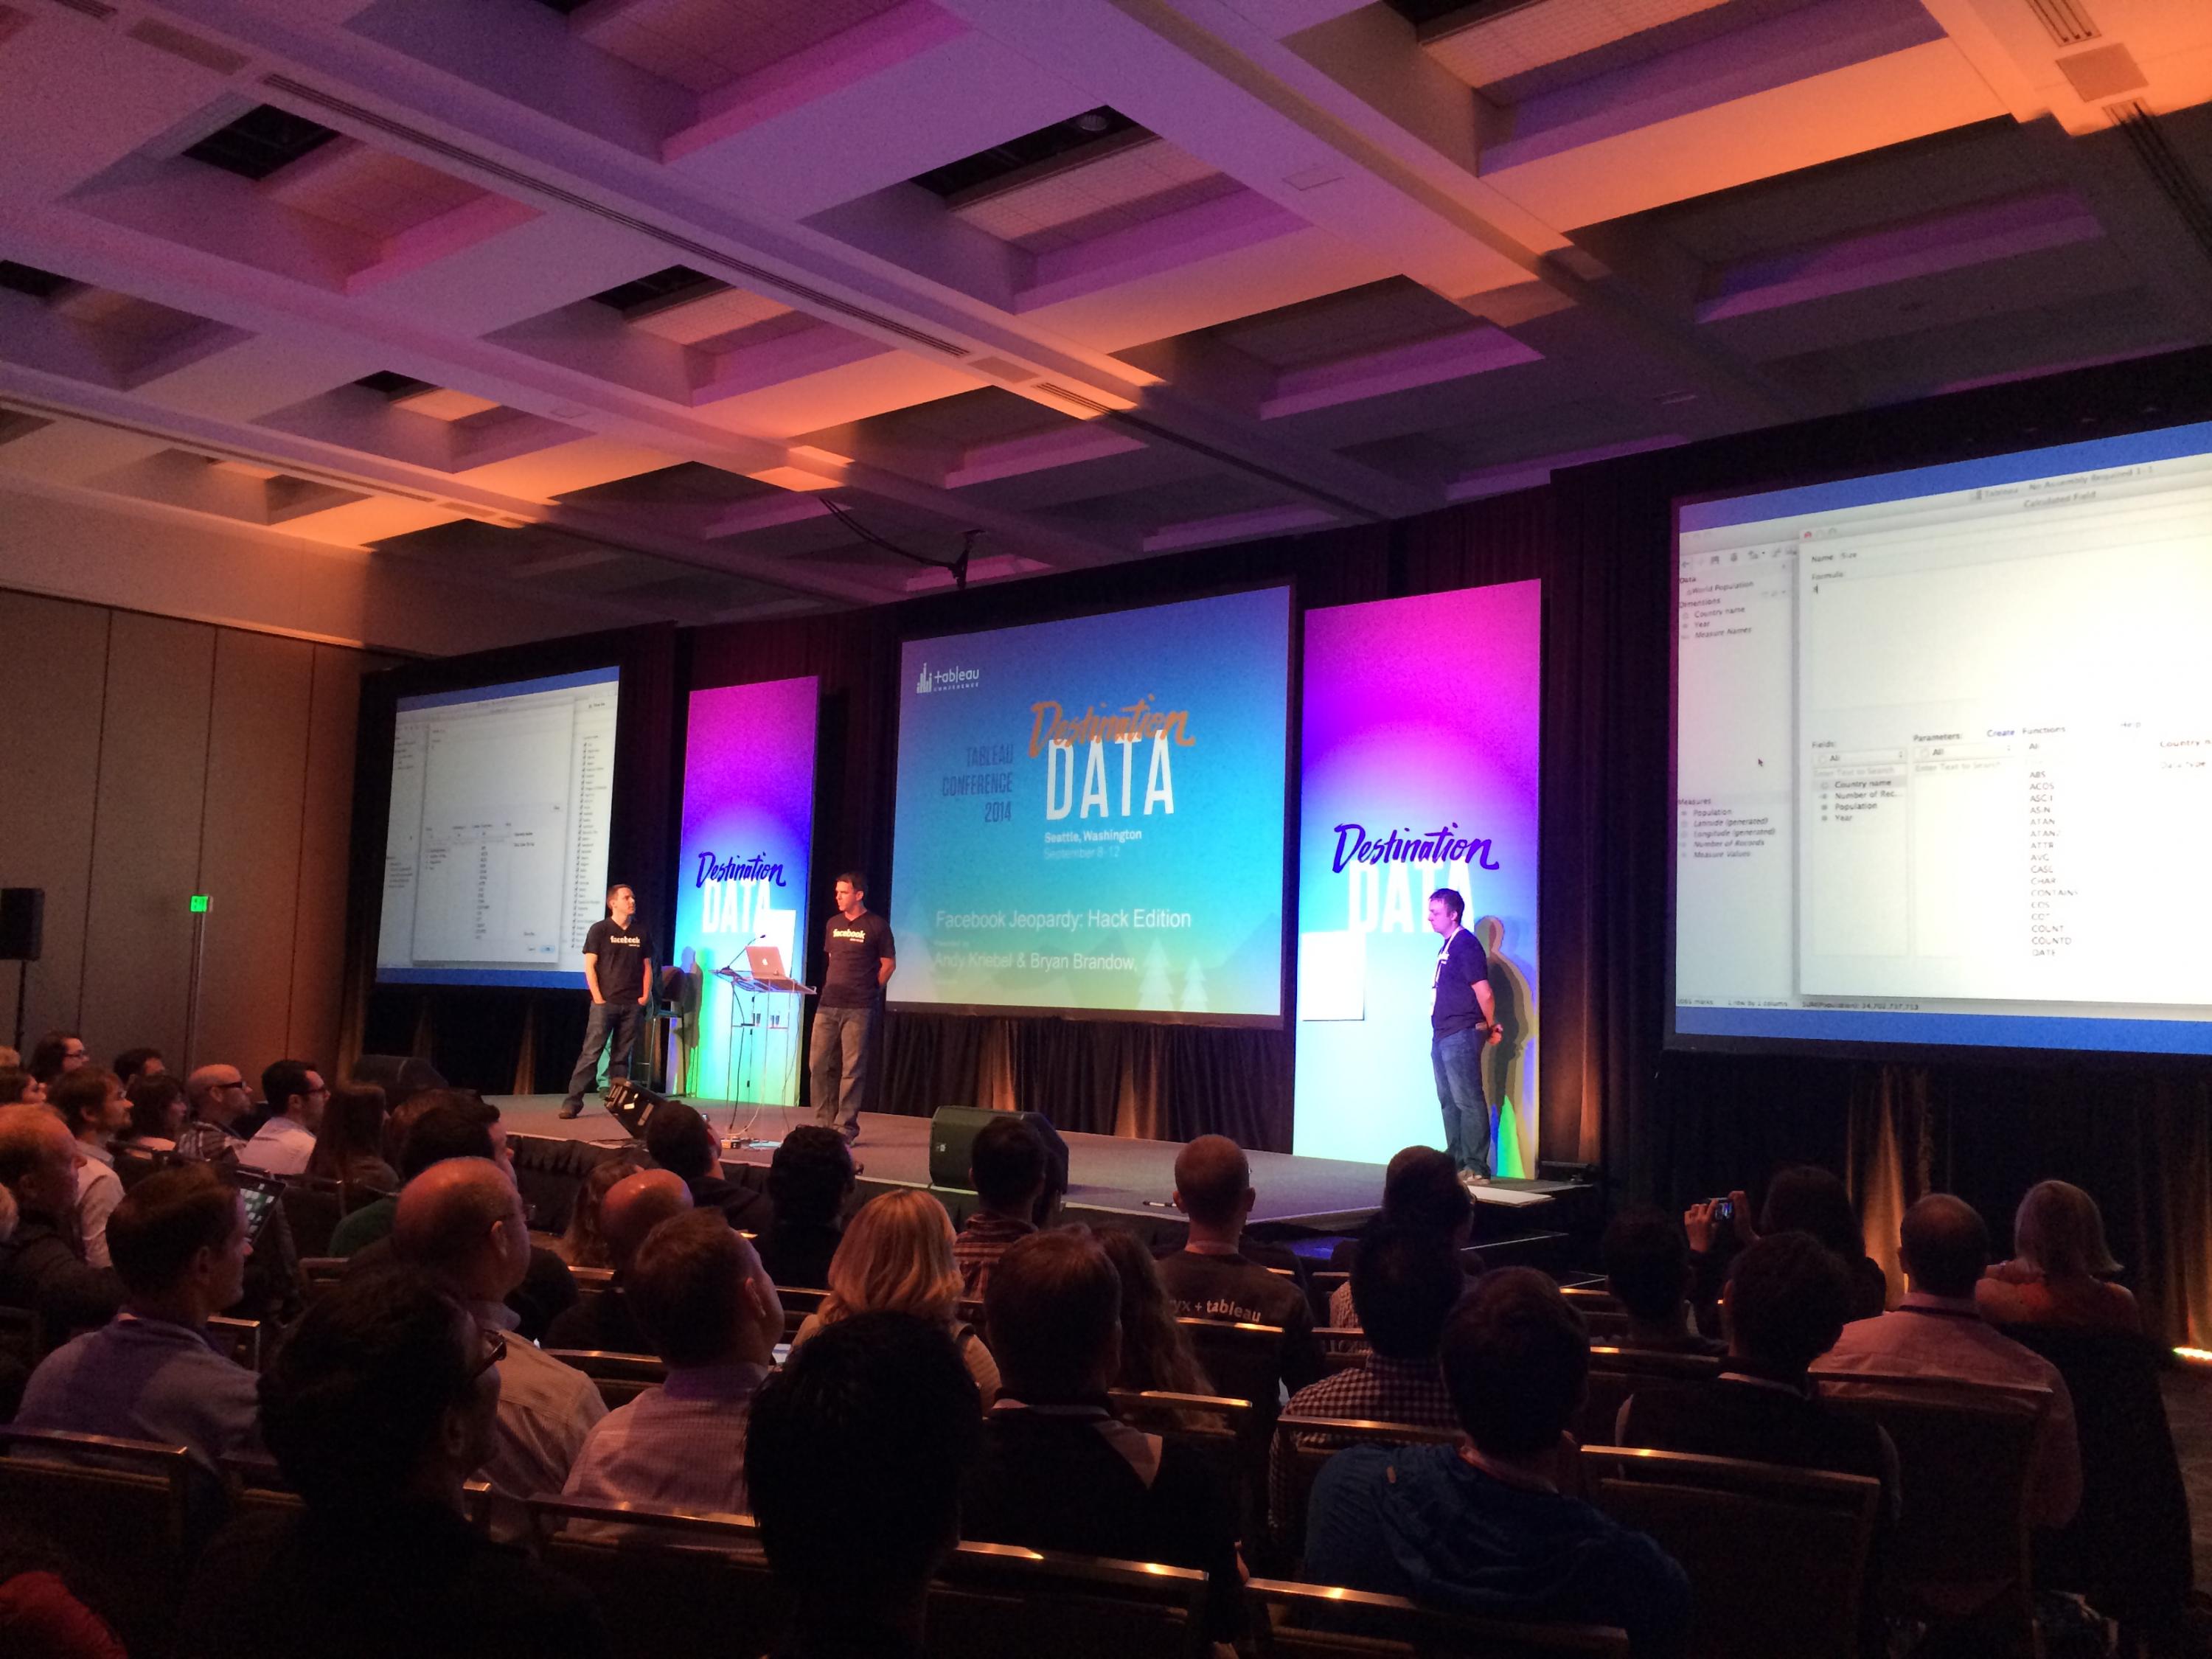
Figure 8: Andy and Bryan killed it with a great breakout!
If you were fortunate enough to attend this session, you learned some very simple “why didn’t I think of that” sort of things and also saw some great hacks. I’m sure that they had help from many of the talented people at Facebook with those. What I loved best about the session is that it exemplified best the values of Facebook (hacking a solution that works) with the values of Tableau (using the tool to its fullest potential). The two are masters of their craft. Watch the video below if you didn’t get to attend. It will be worth the 50 minutes, I promise.
Video 3: Facebook Jeopardy: Hack Edition.
Breakfast with Hans Rosling
What can I say? The godfather of Tableau at InterWorks gets all the fun assignments. My Zen Master status garnered me an invitation to have breakfast with the master of data storytelling, Hans Rosling. I first met him at the Tableau Conference last year in London. I told him my favorite Hans Rosling “moment” came from a Ted Talk where he swallowed a sword to prove that “the seemingly impossible was possible.” Hans agreed that was his favorite moment as well.
There were less than 30 people that received invites to this breakfast. As far as I could tell, if you were a Zen Master, an Iron Viz finalist or a very lucky Tableau employee, you got a seat.
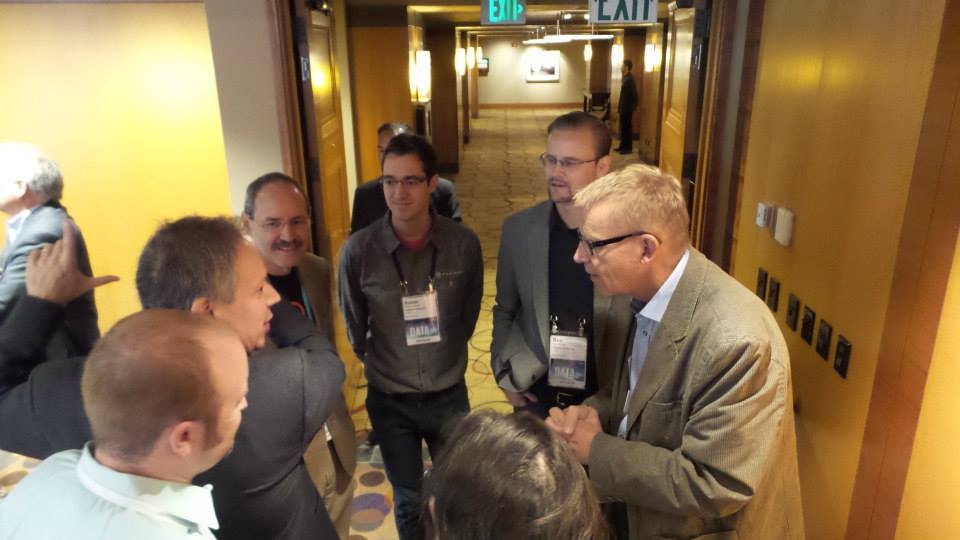
Figure 9: Zen Master, Steve Wexler, (middle left) speaking to Hans Rosling (far right).
Hans Rosling’s first TED Talk from 2006 inspired me to get into this business. Stephen Few’s direct advice pointed me to Tableau in 2007. I can honestly say that those two people were the biggest influence on my subsequent career choice to become a data visualization consultant and start the consulting practice at InterWorks. It was a thrill to attend this breakfast!
The Brain Rules – John Medina Killed It
John Medina’s presentation was entertaining and eye-opening. This year he focused on the effects that sleep has on our mental performance.
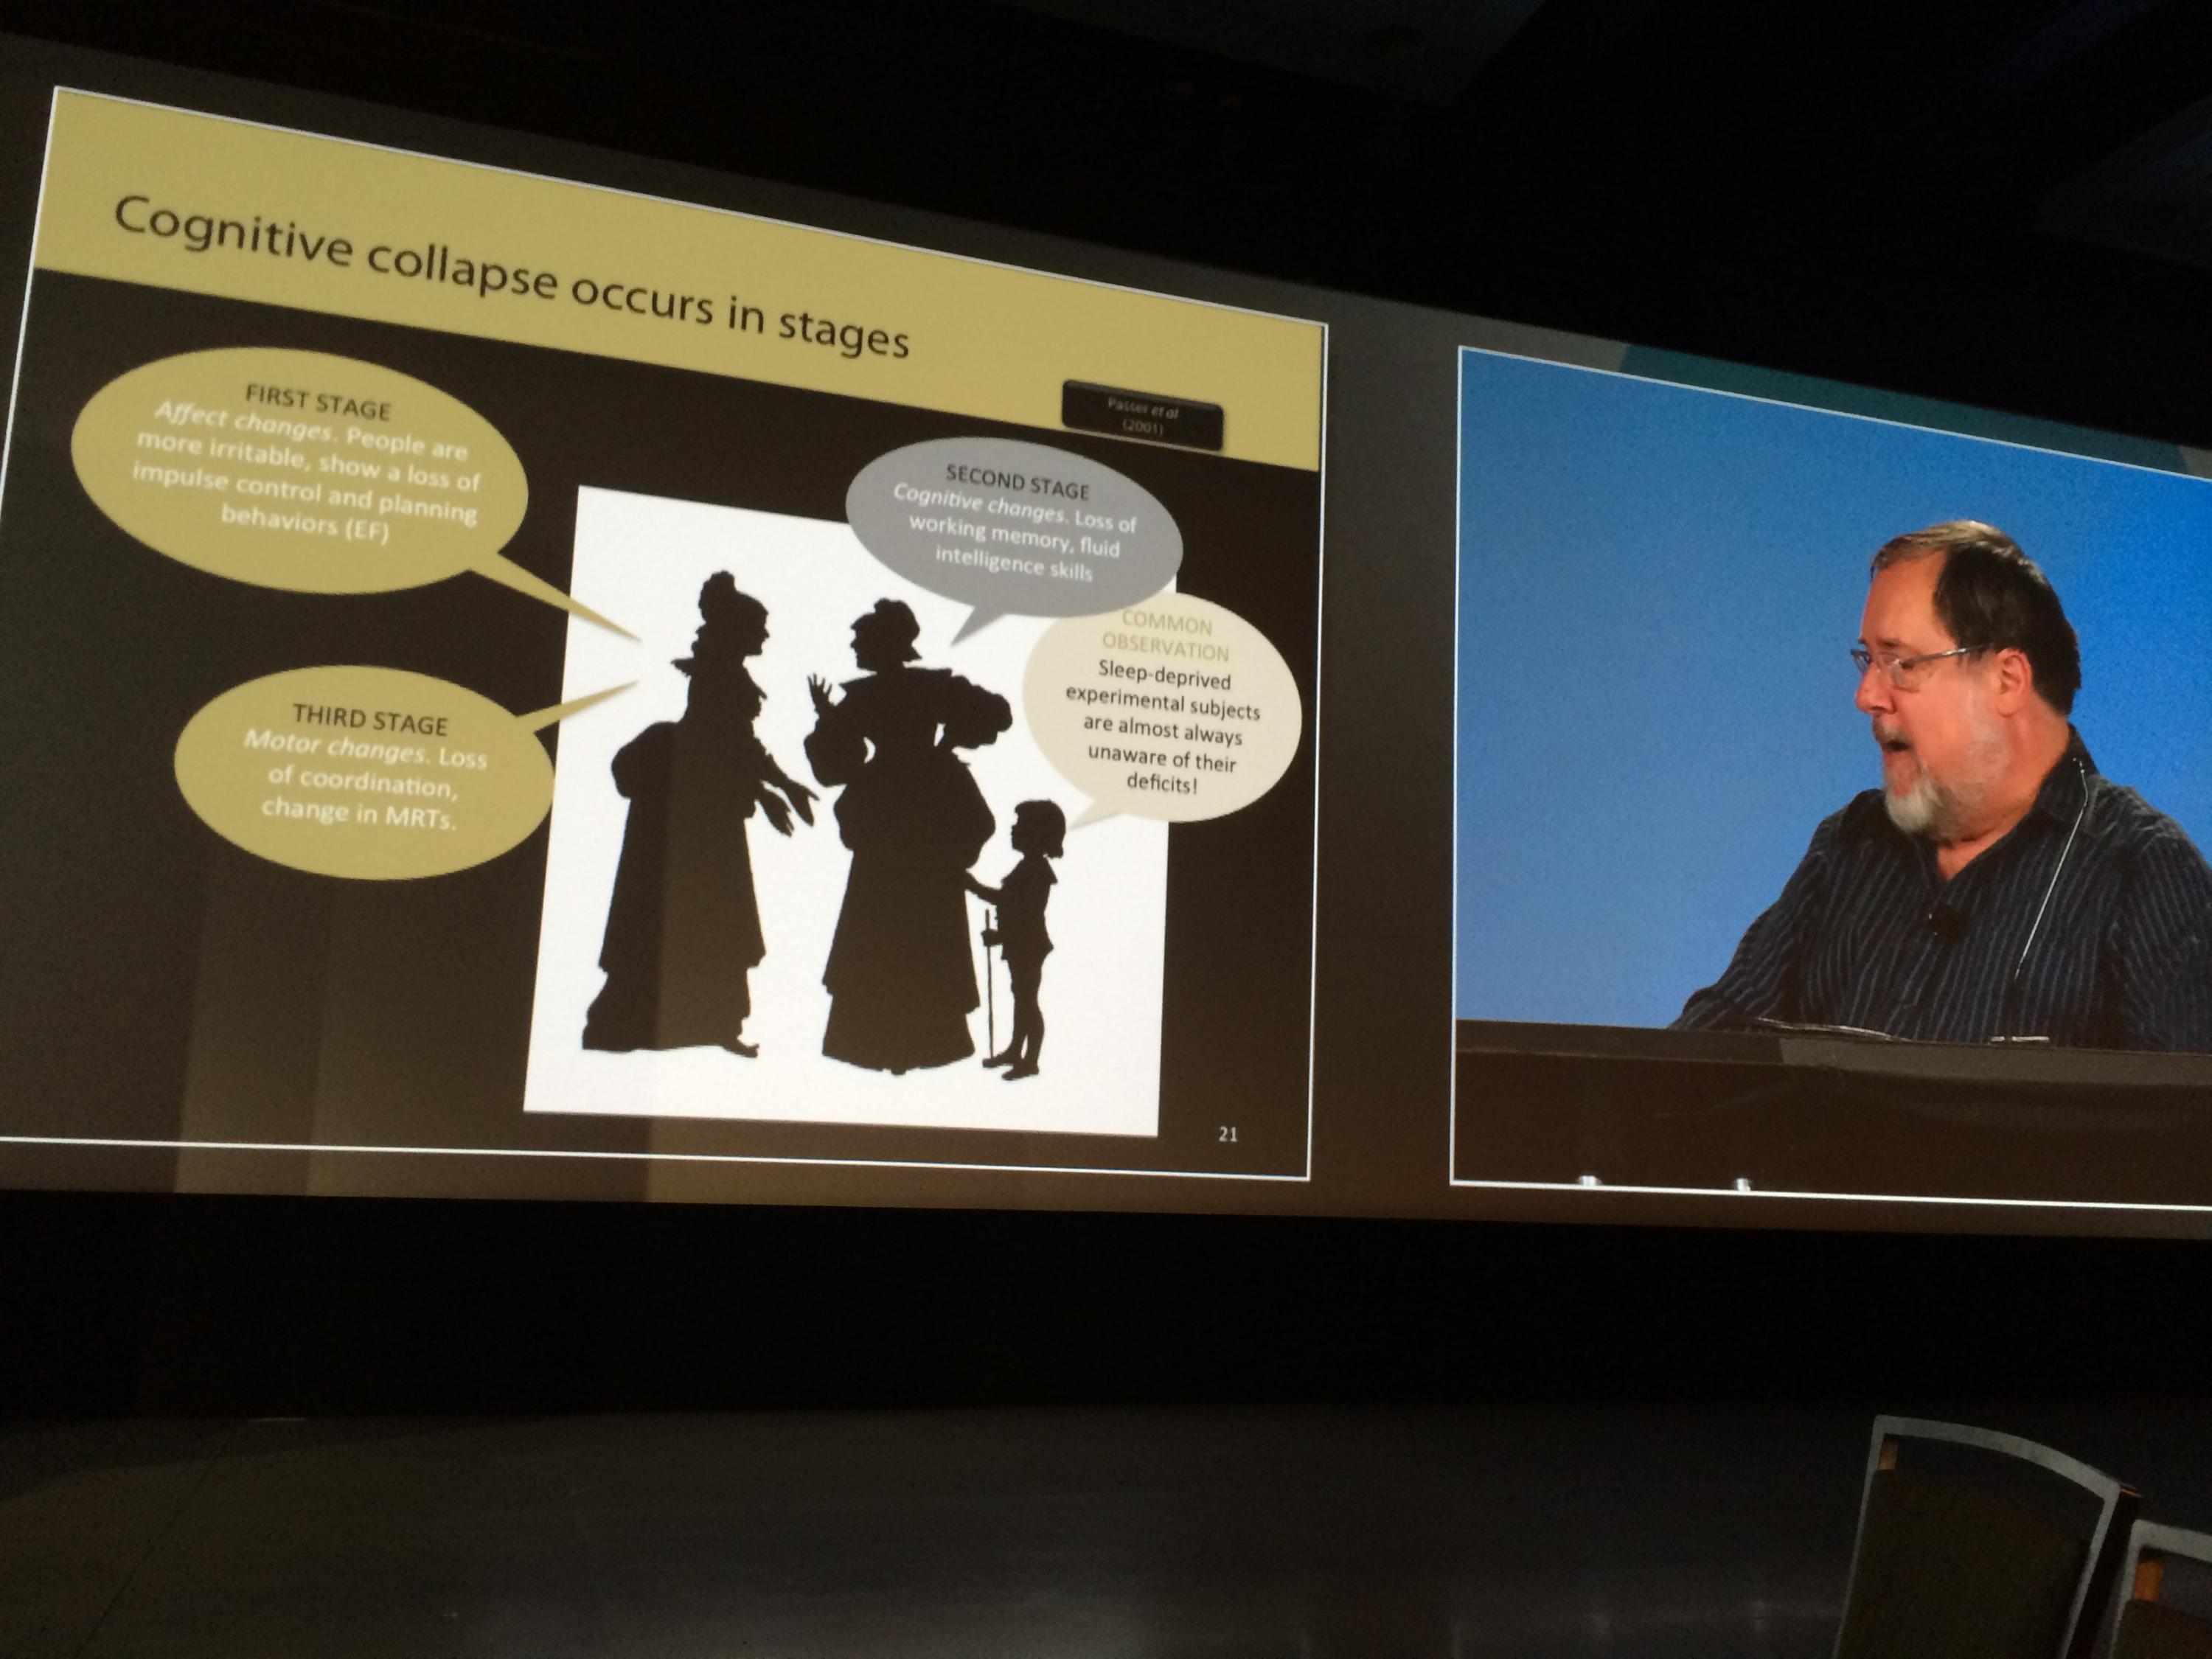
Figure 10: John Medina on sleep deprivation.
The three big take-aways I got from this talk were:
- To operate at peak cognitive performance, get eight hours of sleep.
- It takes four days to recover peak performance after an all-nighter. So, doing them is a stupid loss of productive capacity.
- If you are a night person or a morning person, work to your strength. Don’t alter your normal productive patterns.
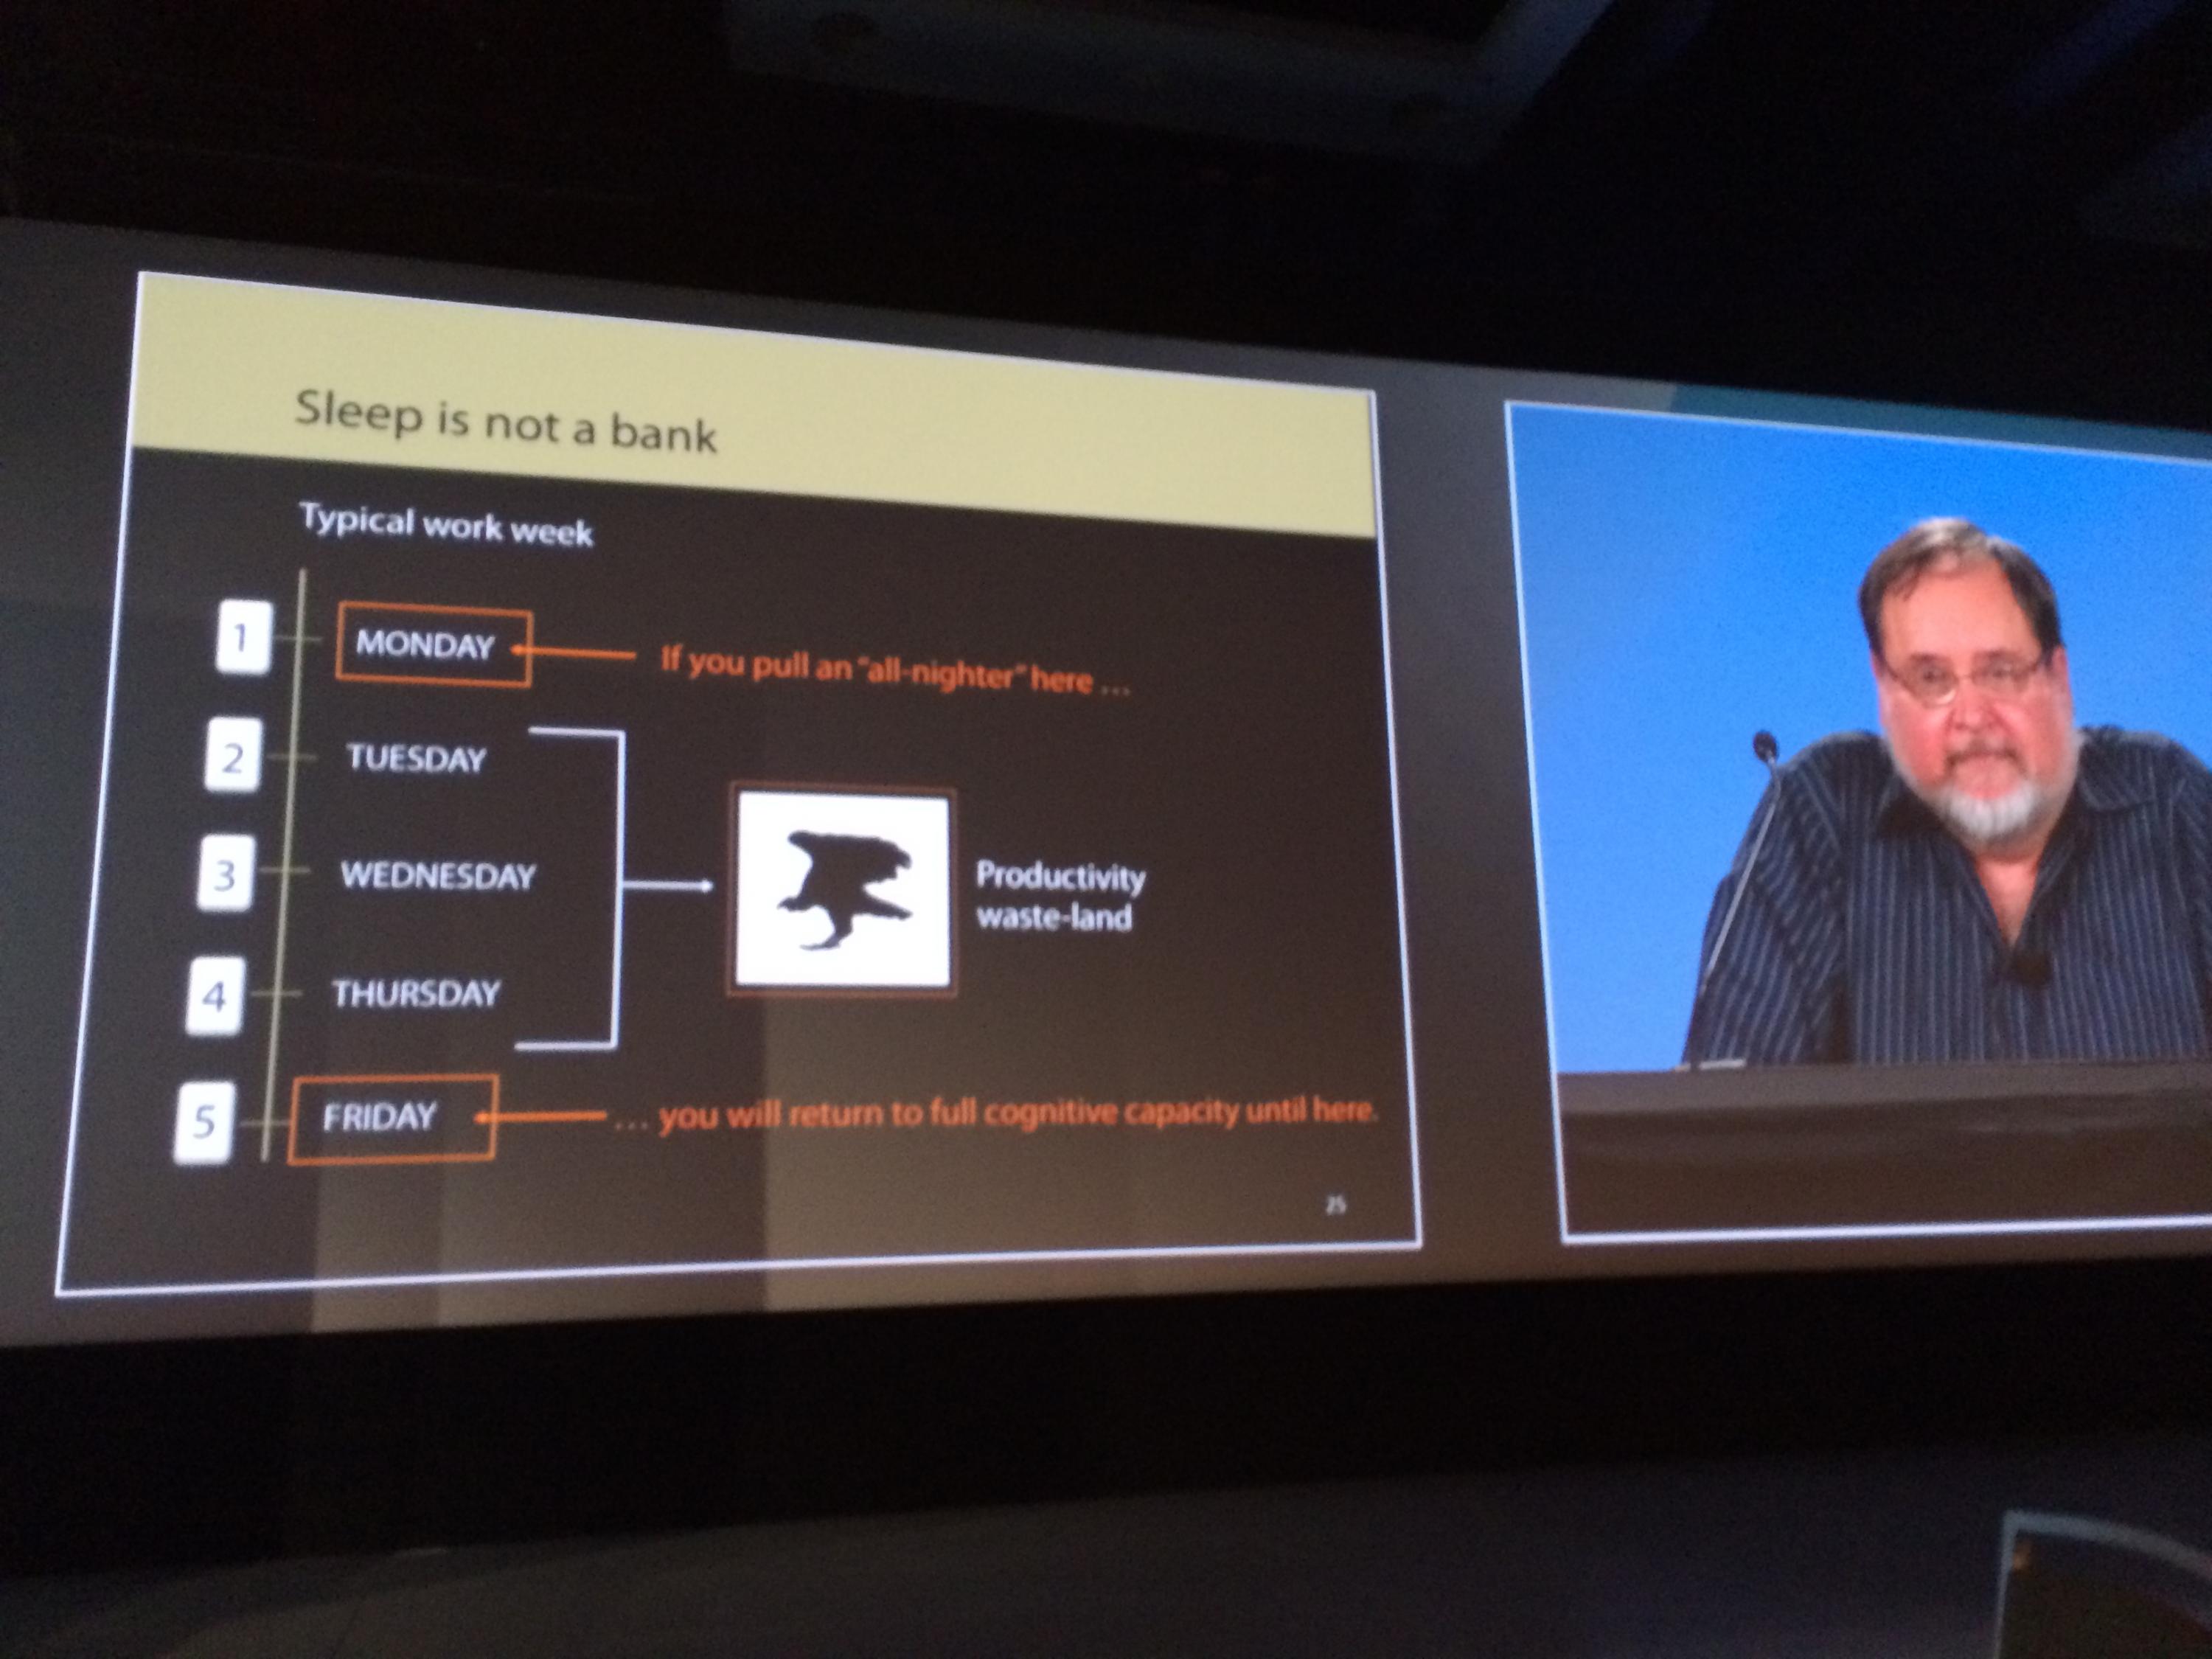
Figure 11: The effect of an all-nighter on cognitive performance.
Later in the week, I was chatting with Pat Hanrahan at the Zen Master meeting in Fremont. Pat admitted that in college, he did most of his productive work at night. But, he married a morning person. Subsequently, he adapted to his wife’s work patterns. After seeing the Medina speech, he was wondering if he has been wasting his most productive time. Let this be a lesson to mere mortals: Pat is successful because he’s always wondering how he can be better and how “it” can be done better.
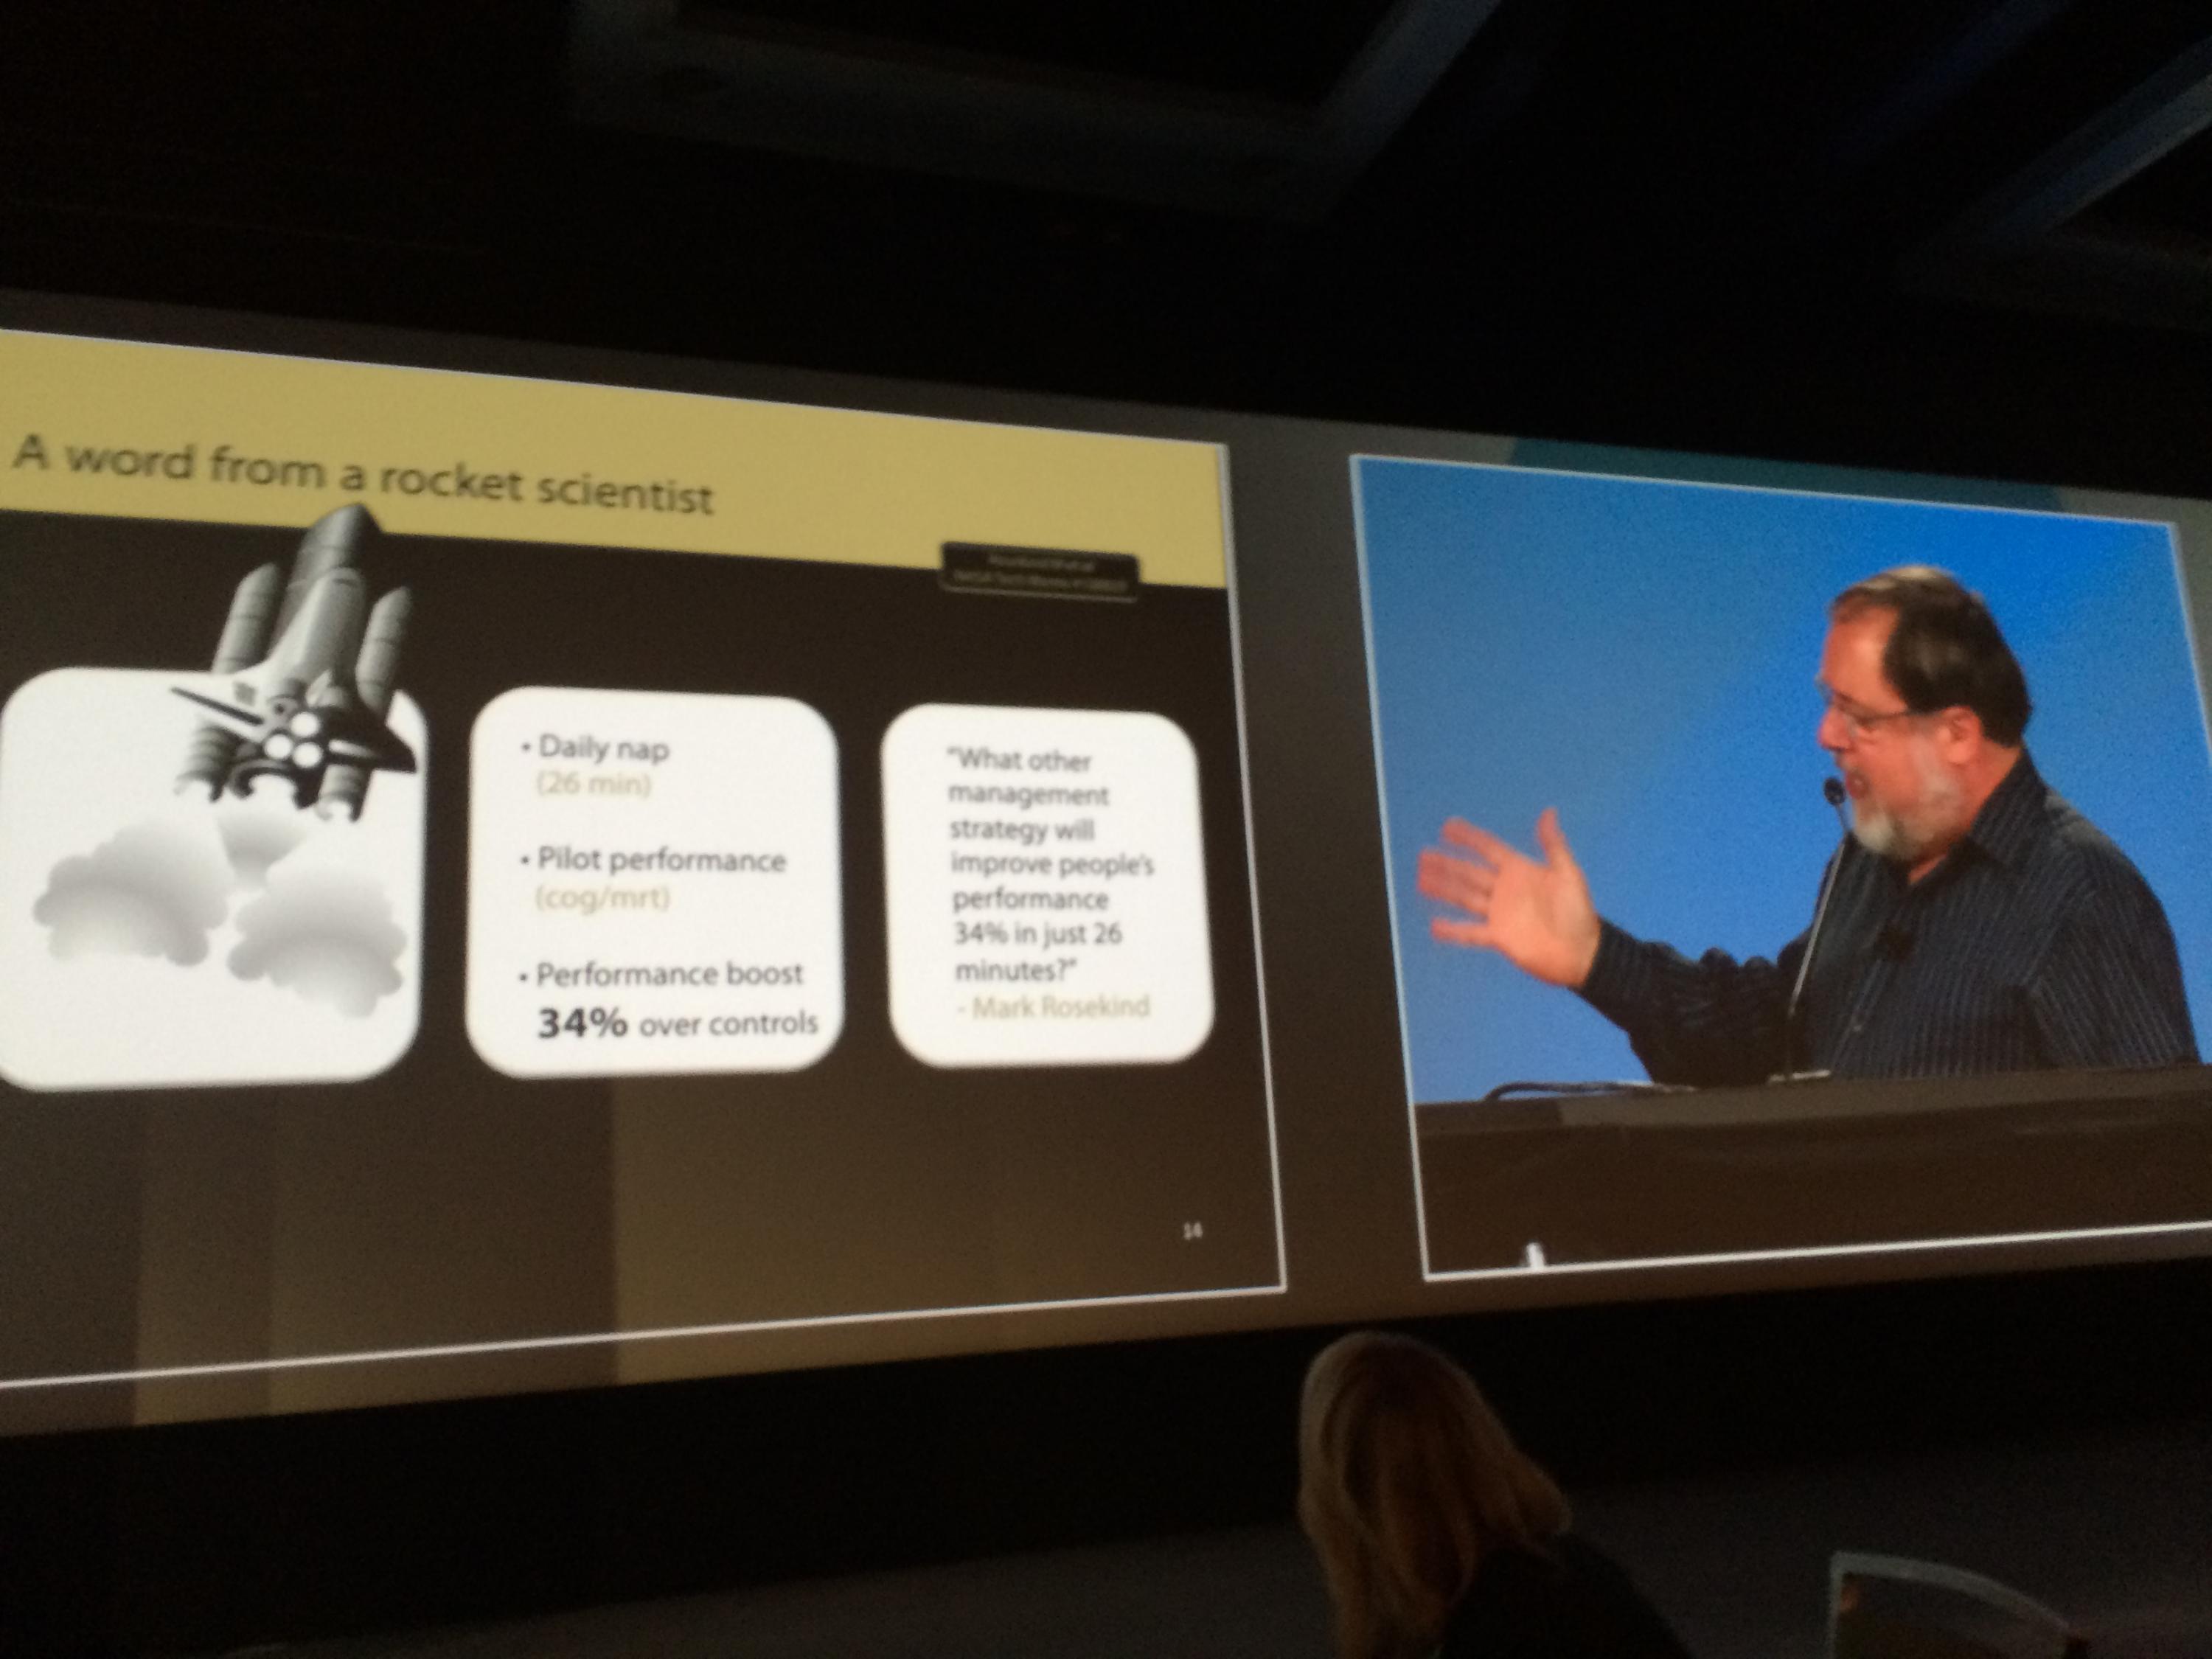
Figure 12: Mark Rosekind quote image.
A great quote provided by John Medina that sums-up his message was provided by Mark Rosekind:
“What other management strategy will improve performance by 34% in just 26 minutes?”
The Iron Viz Competition
The Iron Viz has become an institution at the Tableau Conference for the past four years. This year’s event delivered on the entertainment factor. All three contestants were winners in my opinion. It isn’t easy to build a dashboard that informs in 45 minutes in front of 500 Tableau experts.
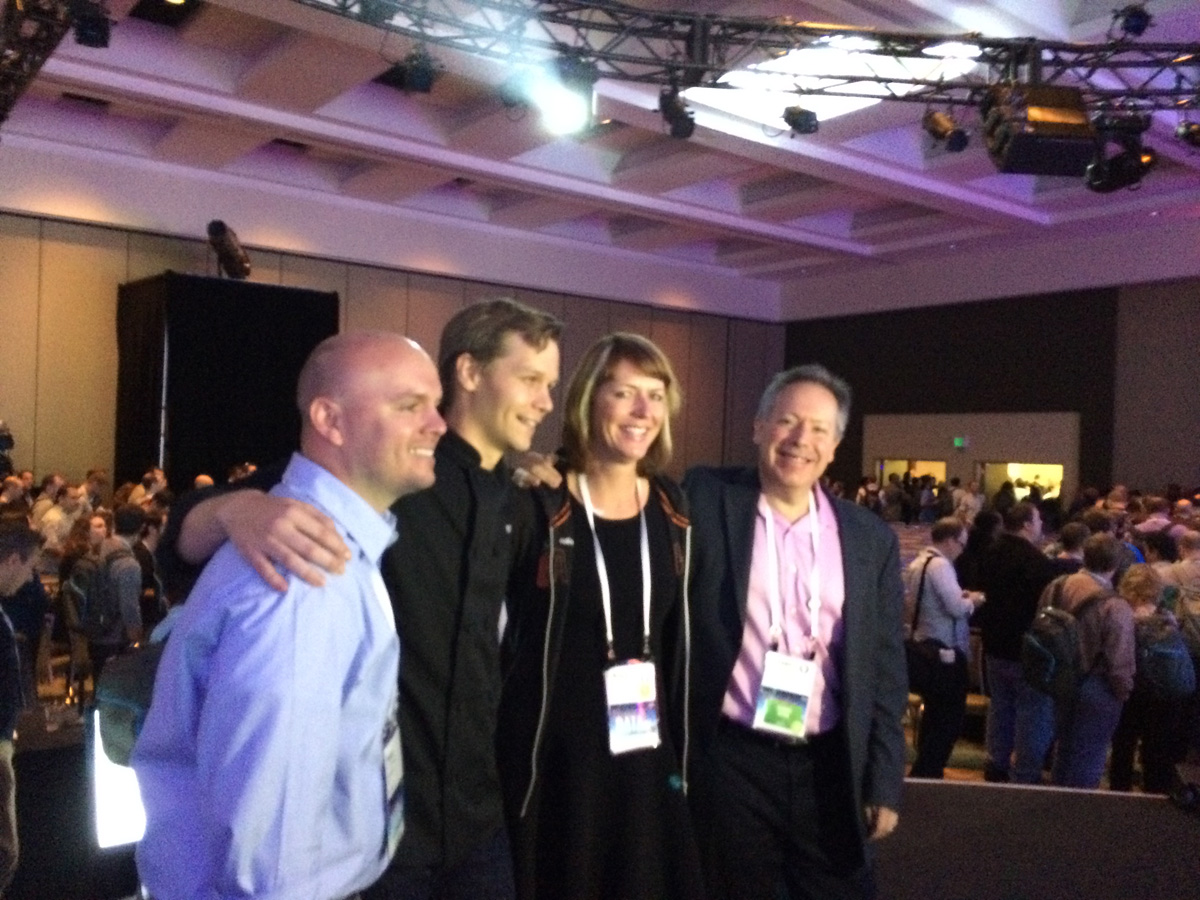
Figure 13: (Left to right) Ryan Sleeper, John Mathis, Anya A’Hearn and Steve Wexler.
The preceding picture shows the last four Iron Viz Champions, including the current Champion, John Mathis. John is a consultant at Slalom Consulting. I’ve met several people at Slalom and find them to all be knowledgeable and thoughtful people. They might be the second-best consulting firm in North America (behind InterWorks). I can’t help bragging a little on our team. Congratulations to John for his excellent viz under pressure!
I Got to Plug My Book!
Many people during the event came up and told me how much “Tableau Your Data!” helped them advance their knowledge of Tableau. Writing a book on anything is difficult and time-consuming. It means more than you know to be told that the book was helpful to you and your learning. It makes the entire 1,000 hour ordeal of writing a book worthwhile.
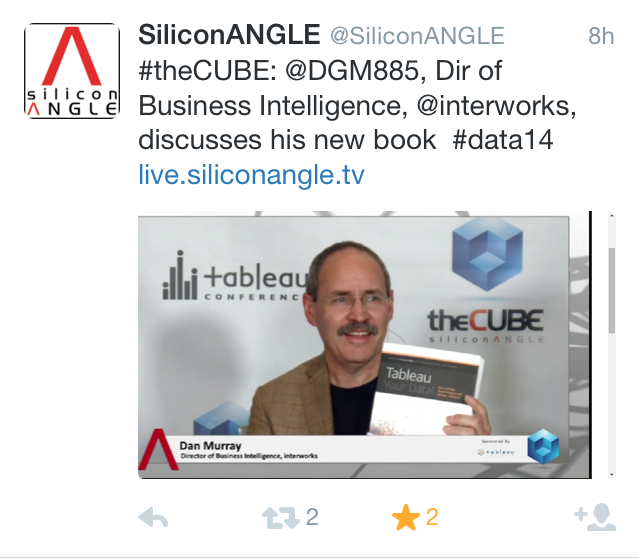
Figure 14: The author plugging “Tableau Your Data!”
Thank you for buying the book! I’m elated that many of you felt you “got your money’s worth” from the purchase. Because of the great response to the first edition, I’ve signed with Wiley to create a second edition of the book which will include everything new through Tableau v9.0. I aim to get that to the printer as soon as possible following the public release of v9.0. That should be sometime in Q2-2015.
Being a Tableau Zen Master
The best part about becoming a Zen Master is finally getting to meet all of the other Zen Masters. The Zen Masters are a diverse, engaging and driven group. You can learn more about them here. Creating this group was a very smart move by whoever came up with the idea at Tableau. What’s even better is that Tableau’s management is leveraging the knowledge of the Zen Masters to inform the development of new releases. Chris Stolte put it succinctly at the meeting we had following the close of the conference when he said, “What you guys are doing today is what we believe the majority of our customers will want in five years. We want your feedback and ideas to inform our development process.”
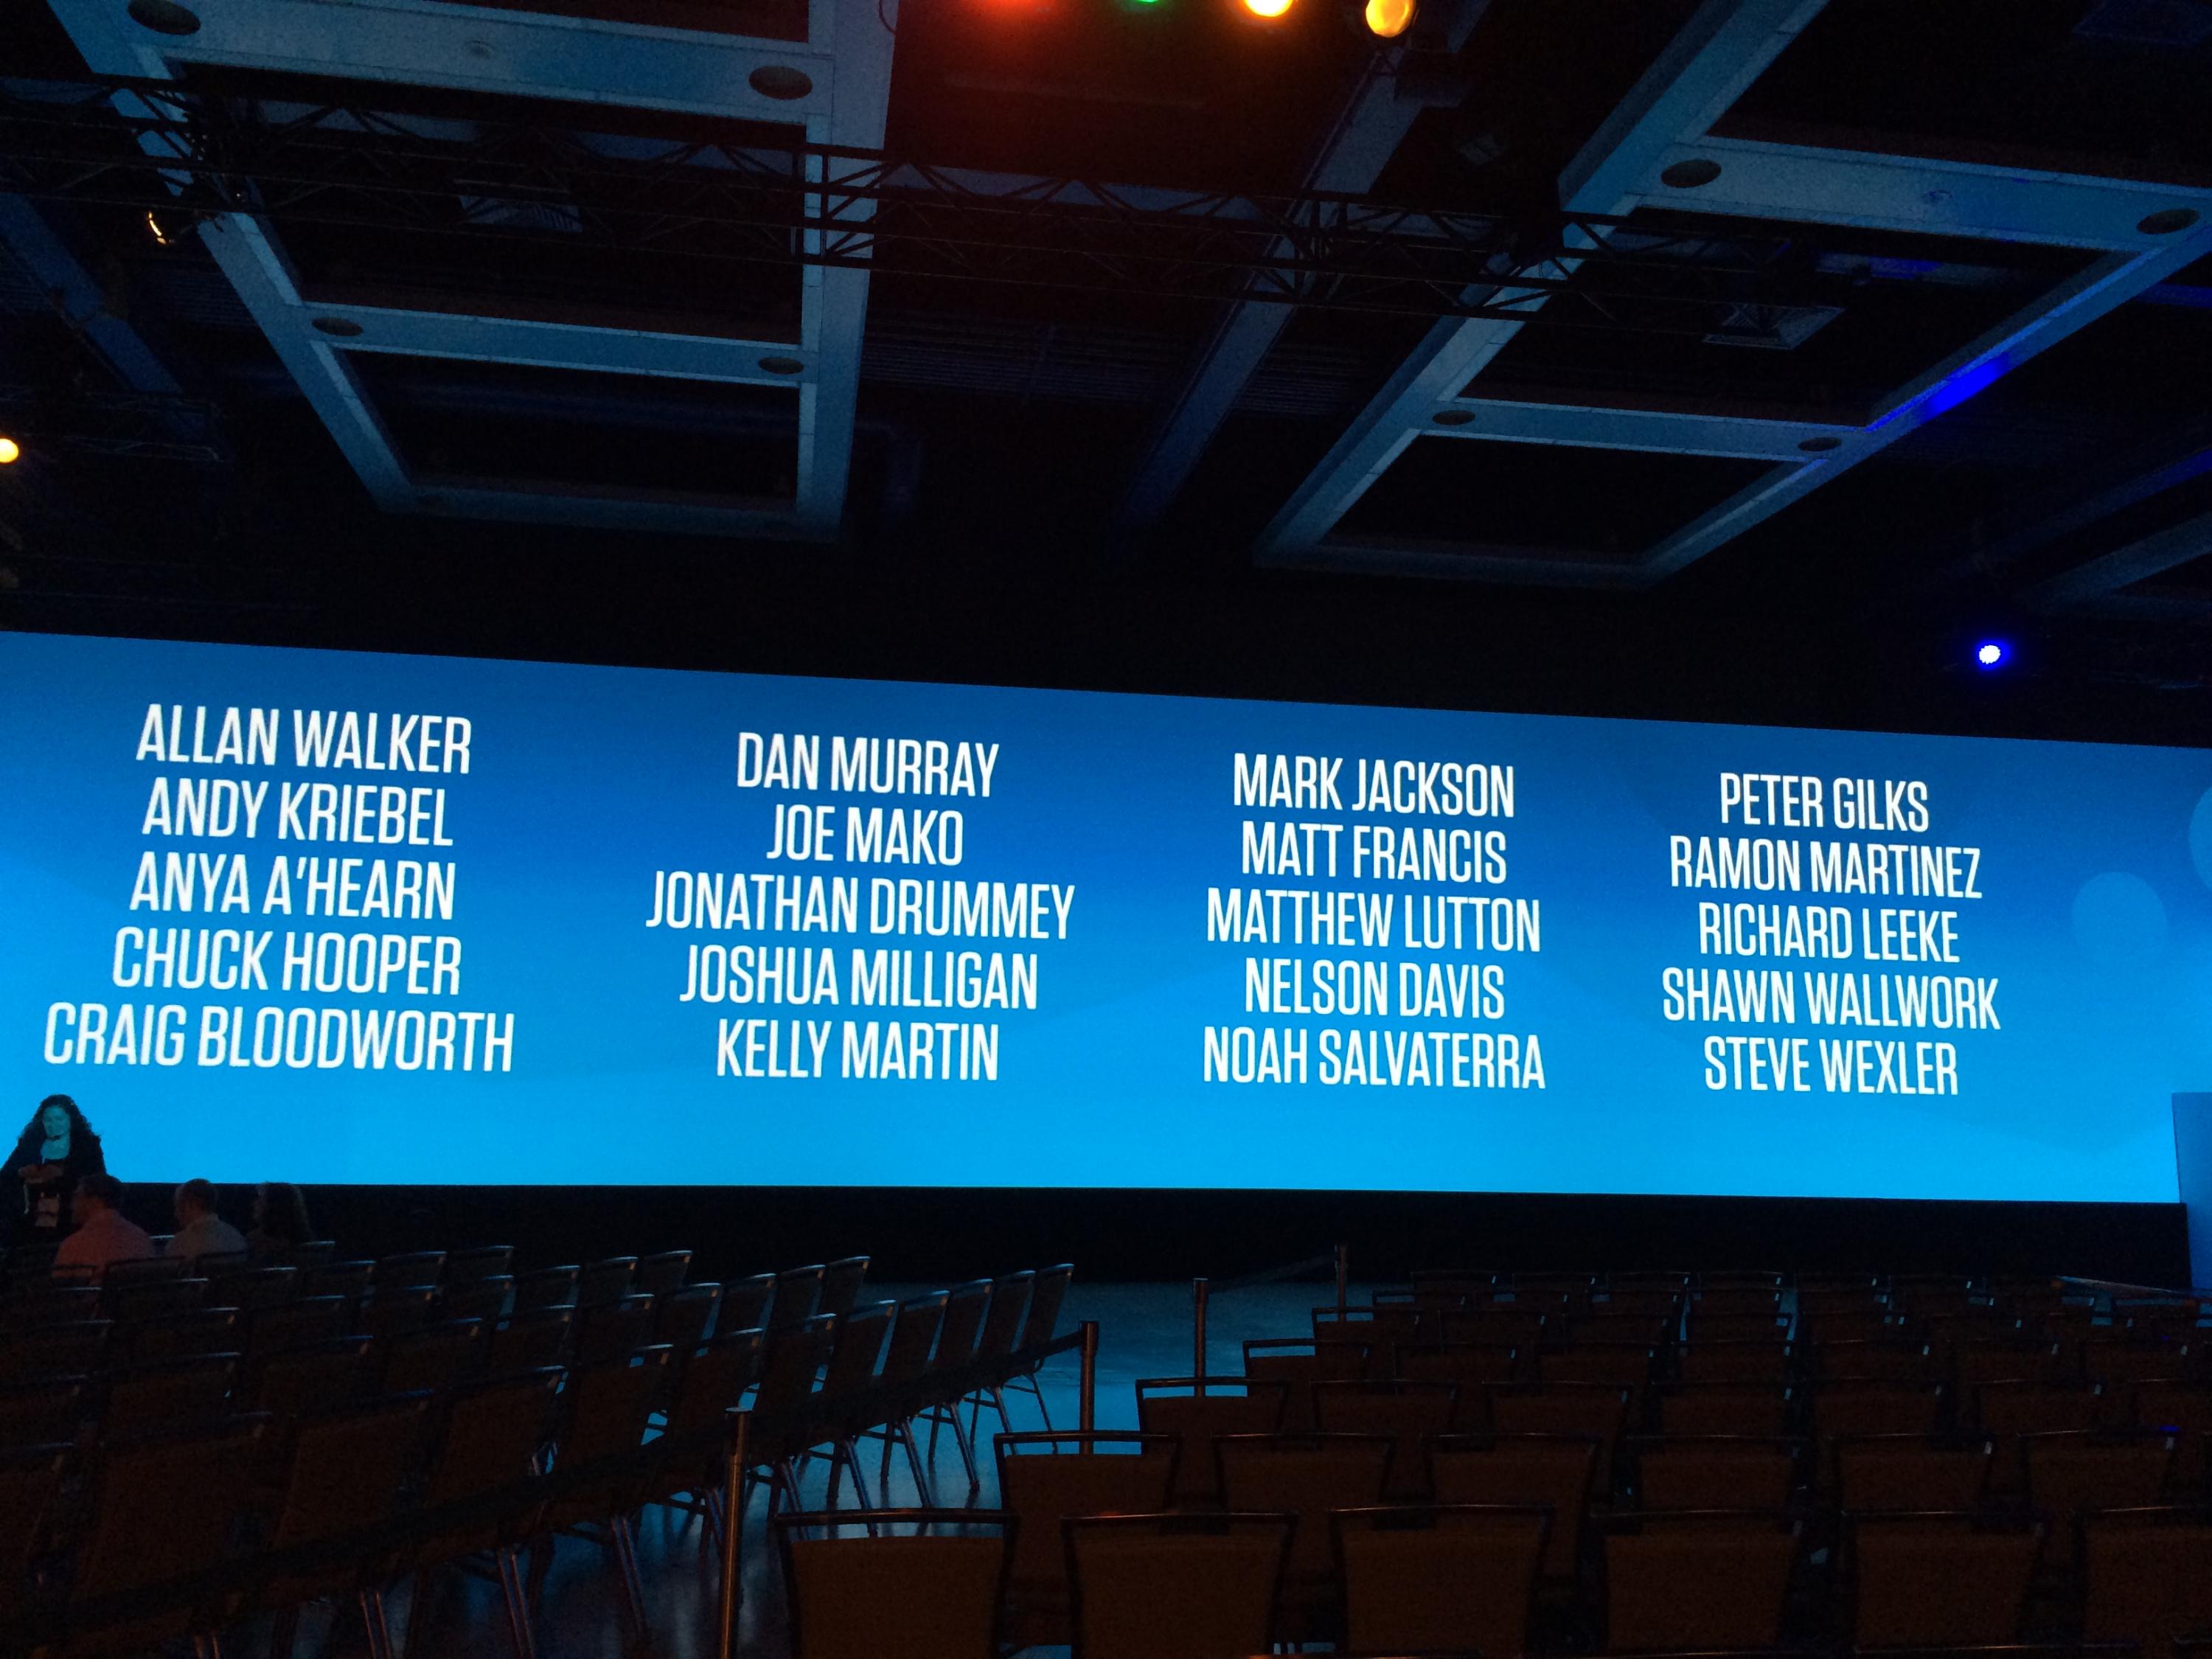
Figure 15: The Zen Masters for 2014.
Being recognized as a Zen Master is a real honor. Being introduced on stage with these wonderful contributors to the Tableau community was tremendous. This is what the view looked like from the stage.
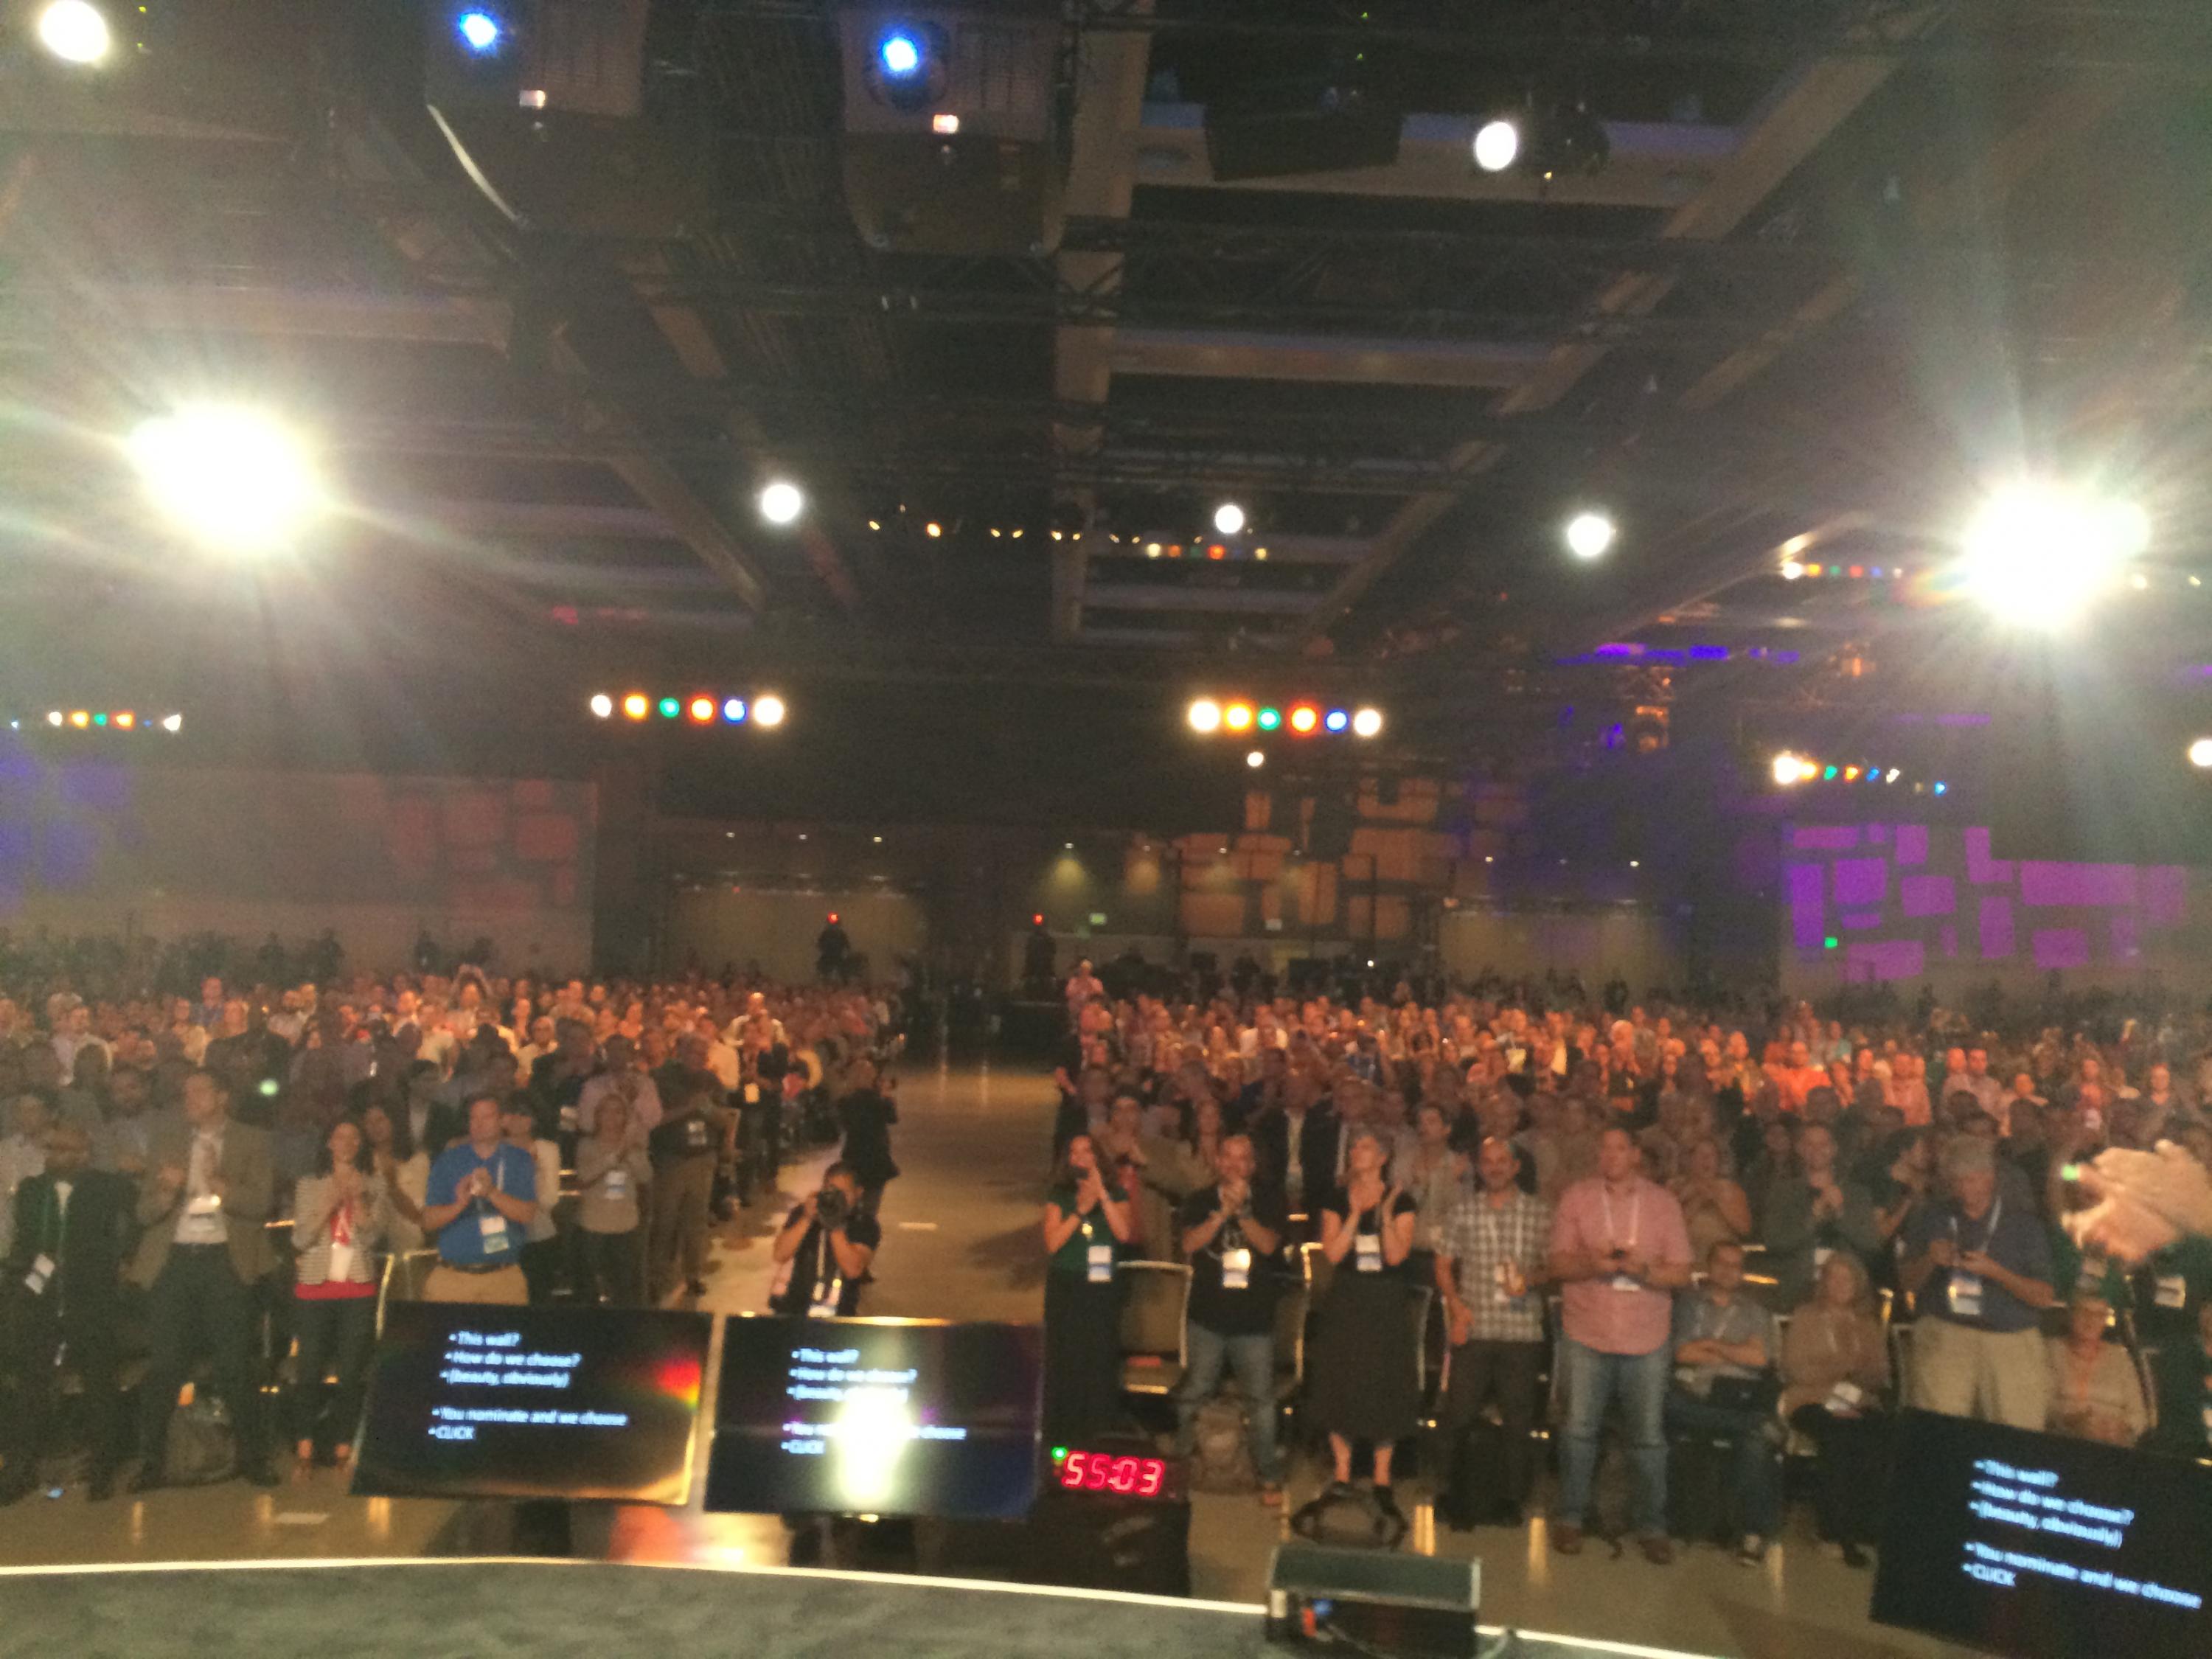
Figure 16: The Zen Master view from the stage.
Why don’t you set a goal for next year to make a significant contribution via blogging, speaking or via the Tableau Forum. Maybe you can be a Zen Master in 2015.
The Conference Was a Success
Tableau Software did it again. They topped last year’s show. With around 7,000 customers, partners and Tableau employees attending, this was a big, fast-paced and exciting event. I’ve been to 11 or 12 Tableau Conferences in the last seven years. I can confidently say that if you missed this year’s event, you really did miss the biggest and best data geek festival in the world.
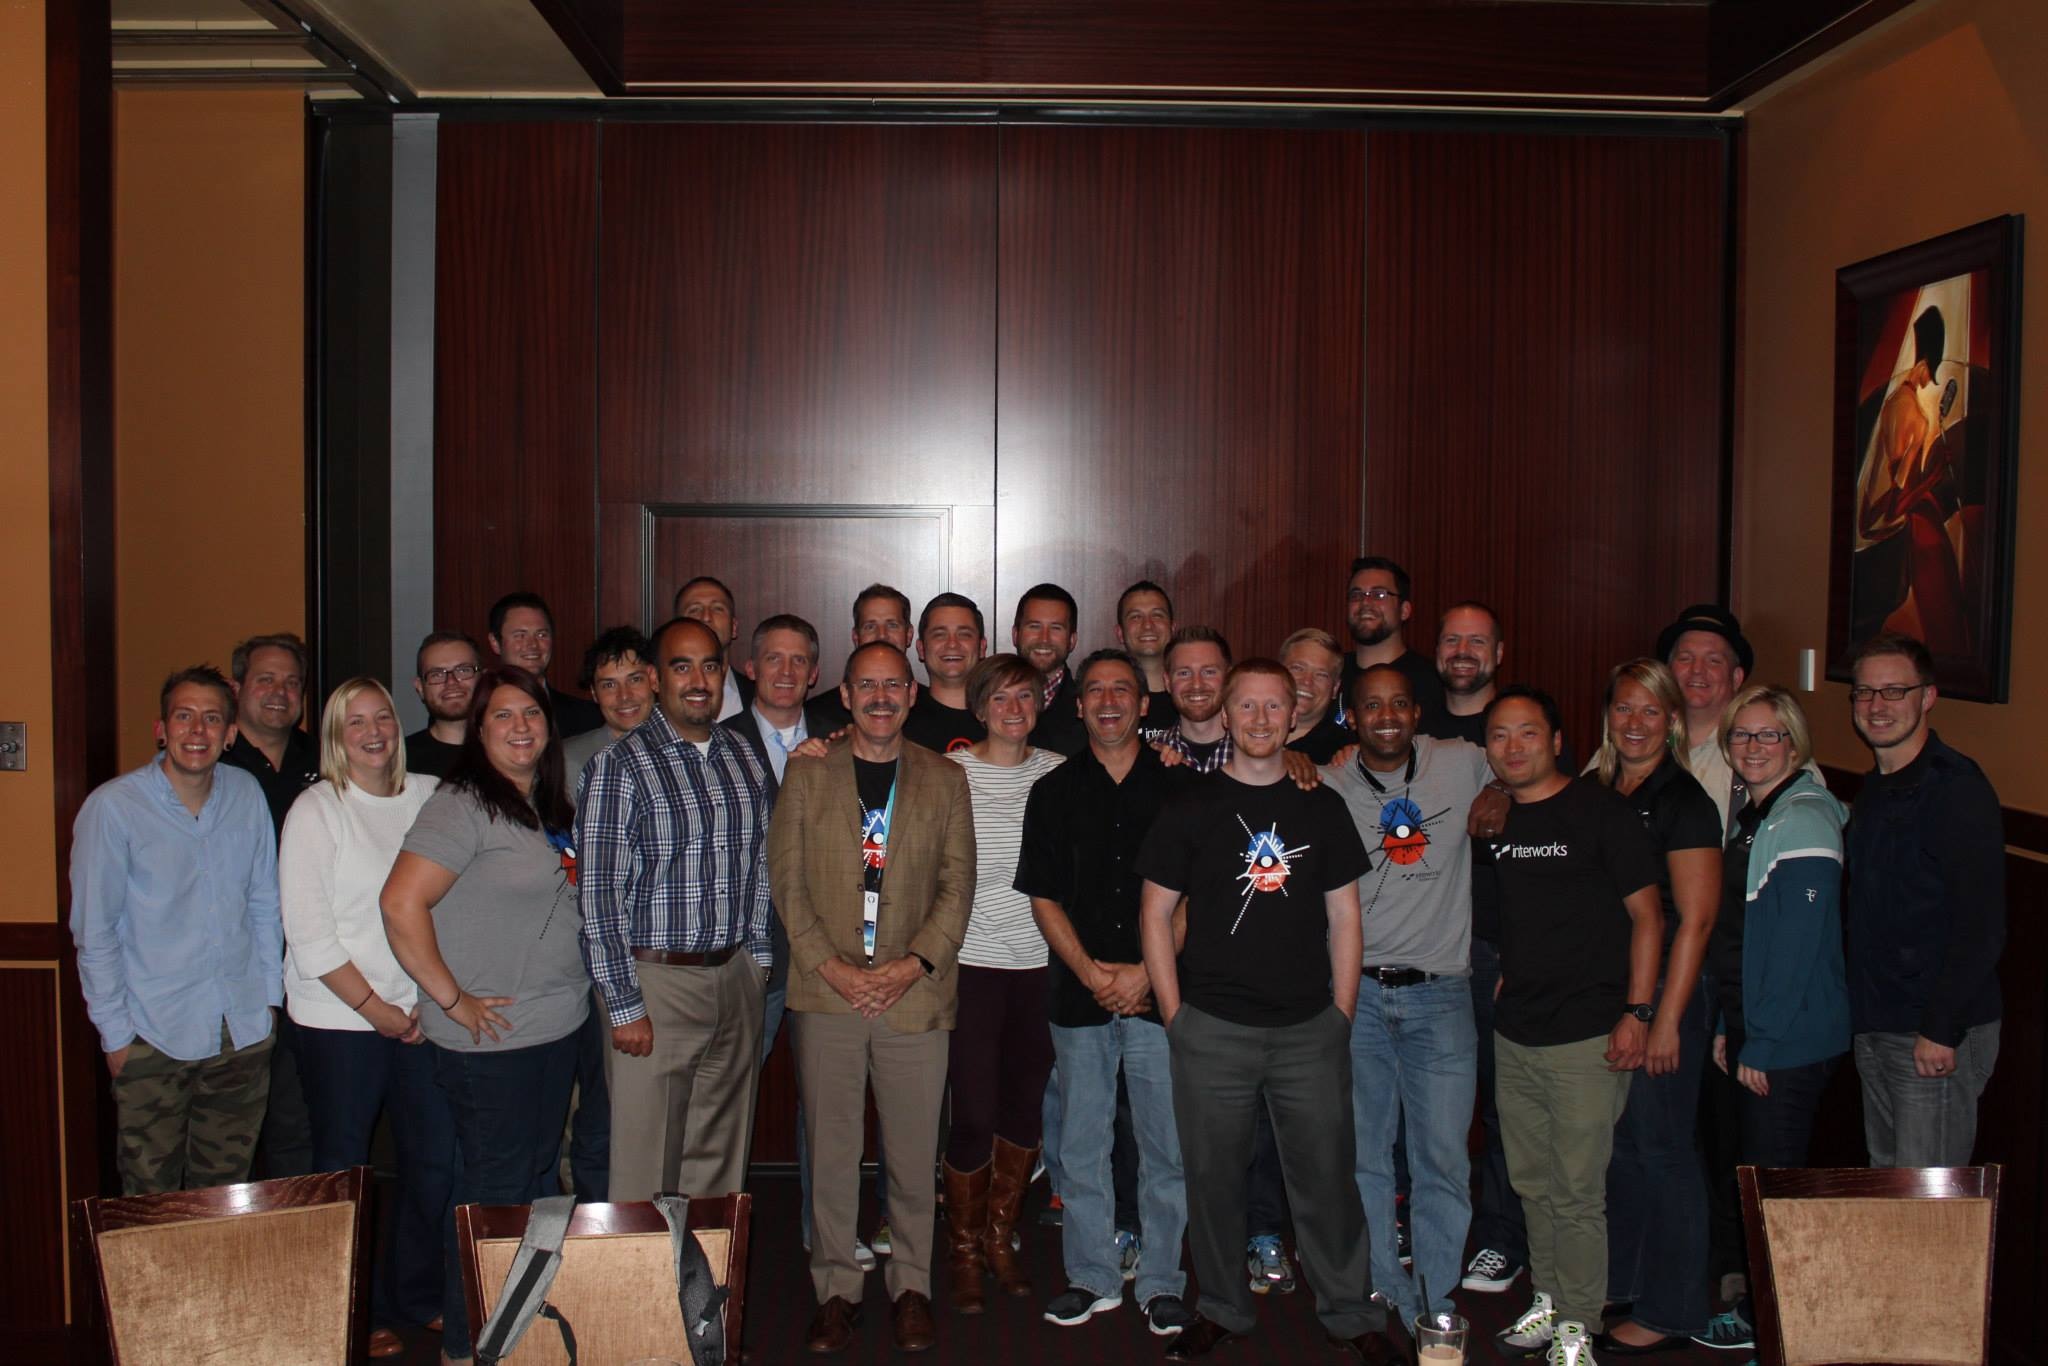
Figure 17: InterWorks’ conference team at dinner.
It was a fun and fast-paced learning experience. So, get your tickets for next year. When you arrive in Las Vegas, stop by the InterWorks booth and say hello to us.
“Tableau Your Data!” Second Edition
The last 12 months have certainly been exciting. During that time, I finished a book, did a little consulting work, traveled all over the North America and Europe speaking to Tableau User Groups (around 50), gave my first speech at a TDWI event, spoke at some elite companies (Cisco, Netflix, Facebook, and Nike), spoke at some elite universities (Duke and Carnegie Mellon) and became a Tableau Zen Master. It’s all been fun, and I’ve made some great new friends.
After all this, it’s time to start writing another book on Tableau that will cover all the cool new features for Tableau Desktop and Tableau Server. I expect the second edition of “Tableau Your Data!” will add at least 150 pages of new content along with the required additions and revisions to every chapter.
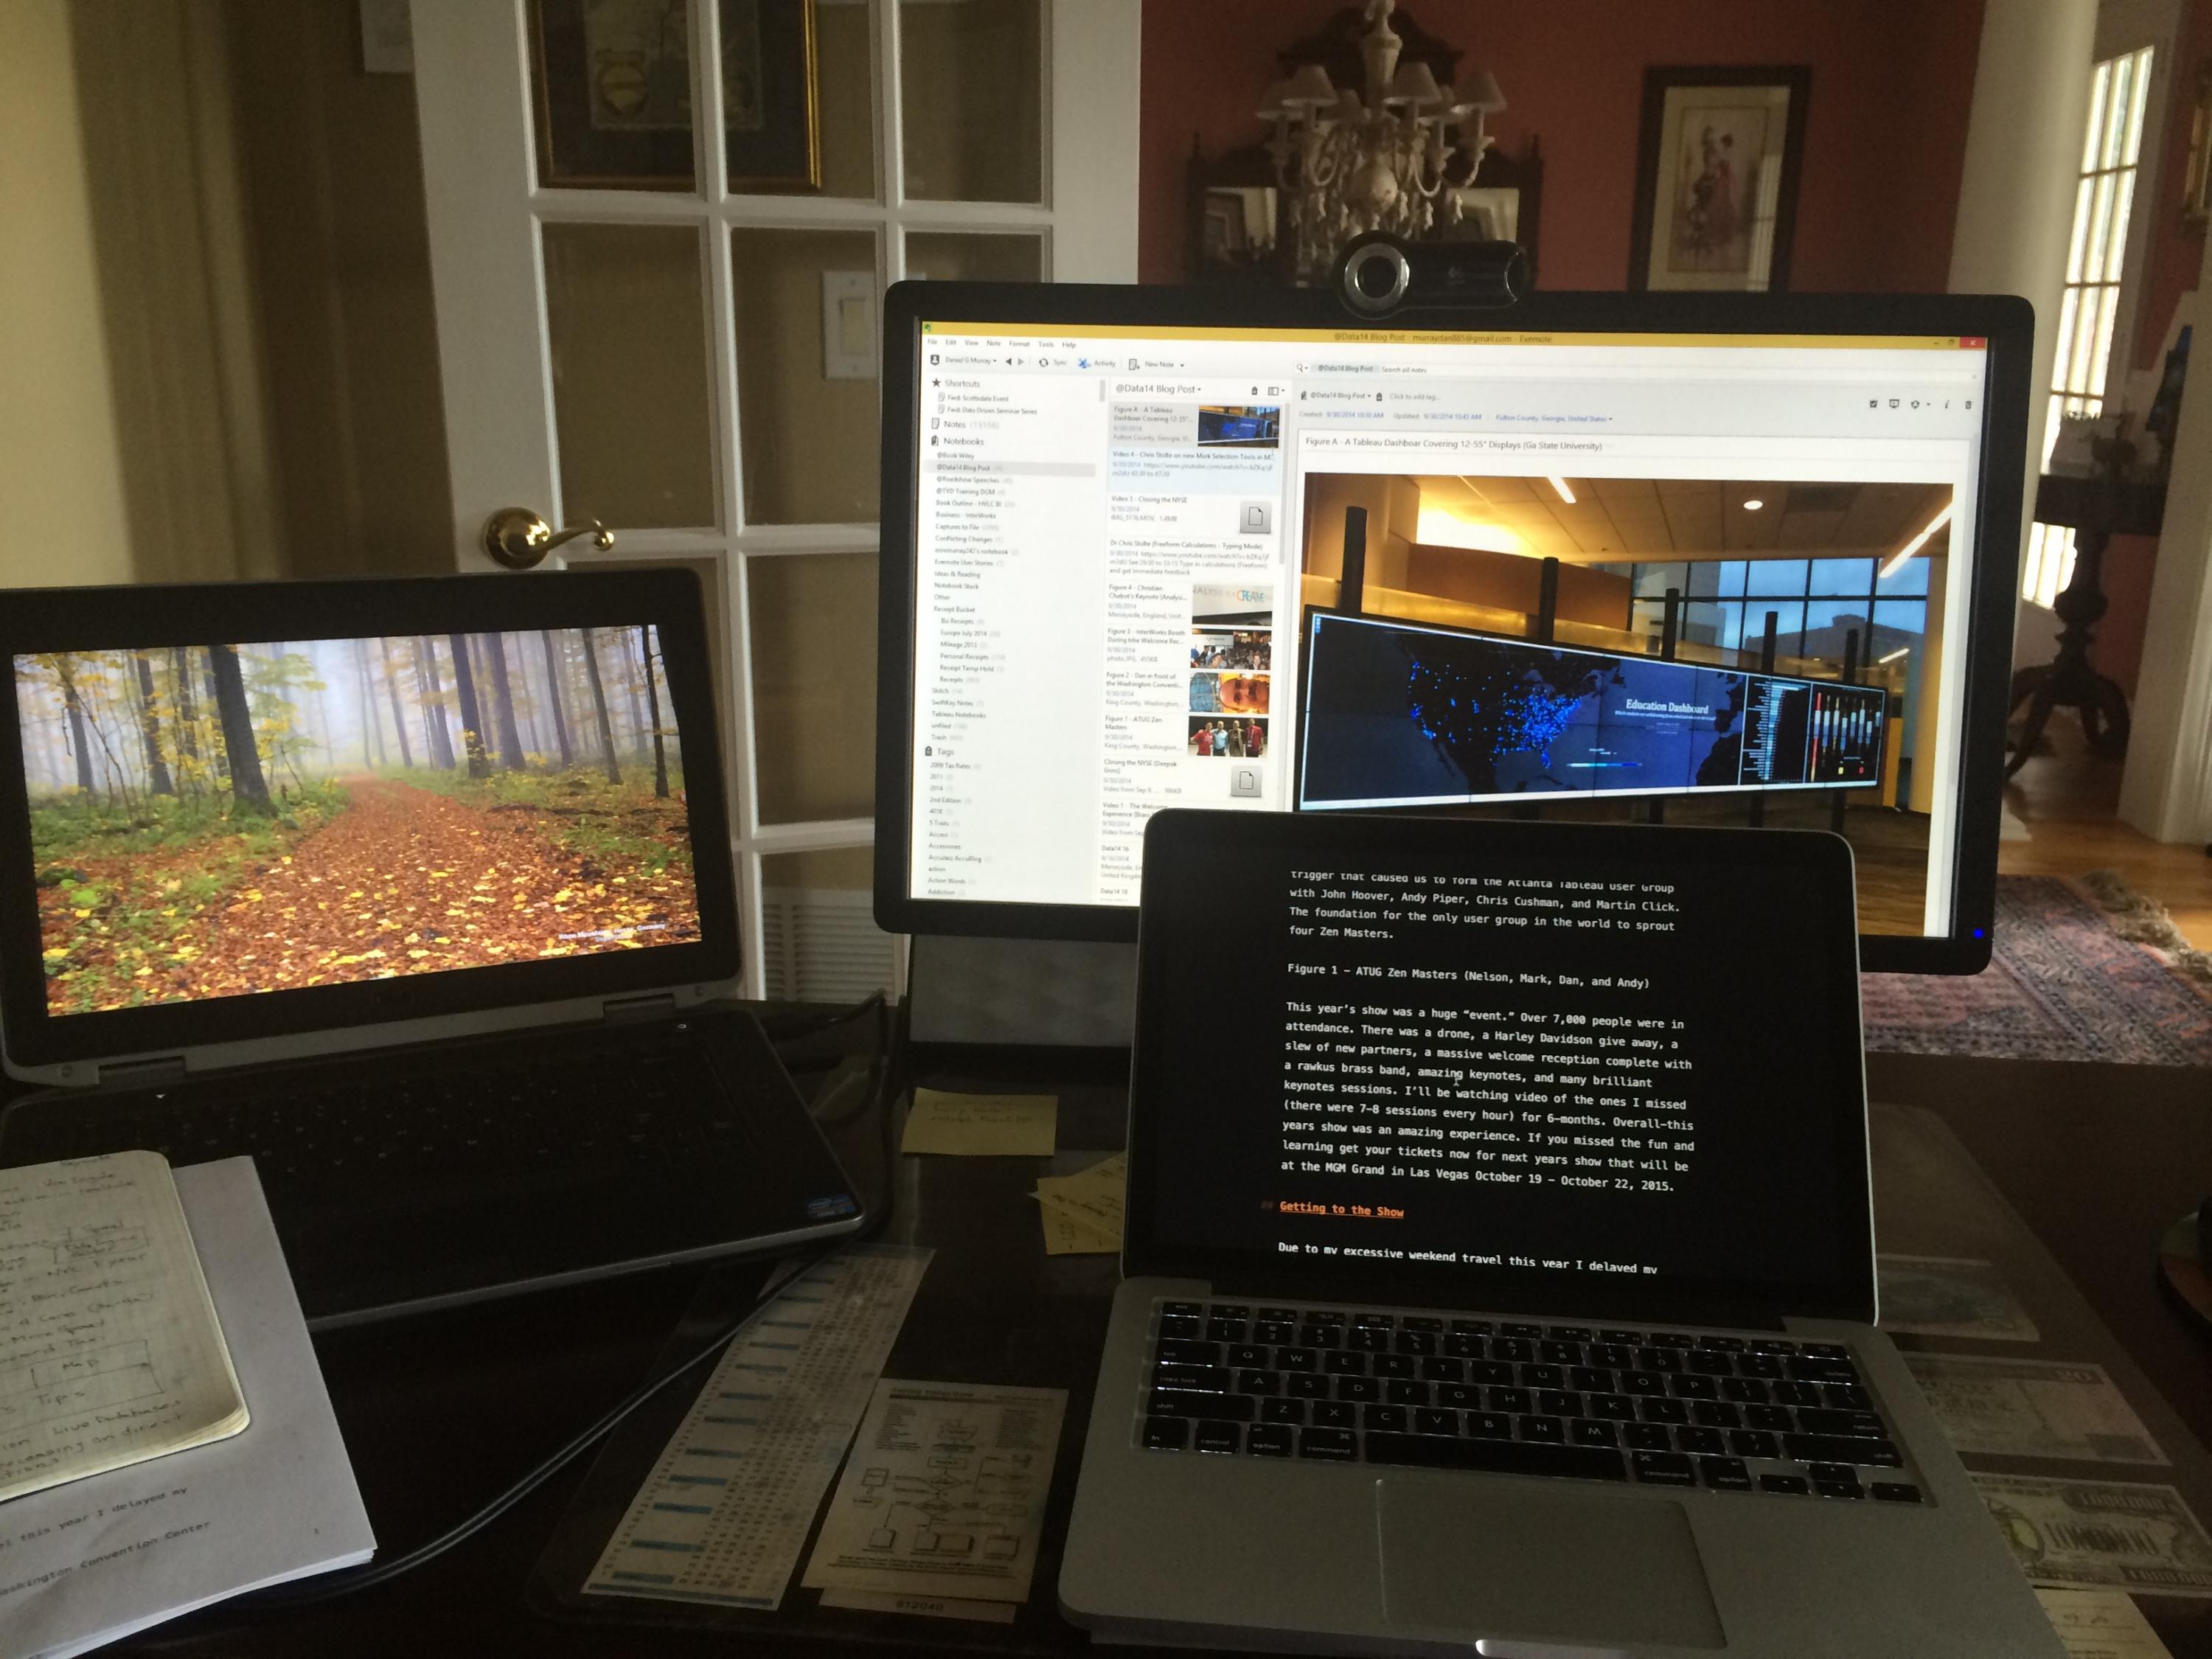
Figure 18: My desk after returning from TC14 and other speaking engagements.
And so another project begins! Thank you everyone: clients, book buyers and especially the wonderful team I have the privilege of working with at InterWorks.