Tableau Essentials: Chart Types – Packed Bubbles
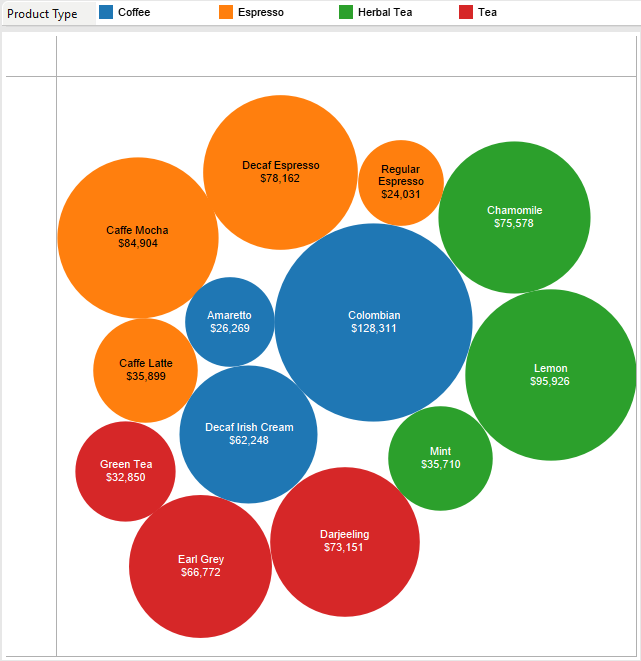
The packed bubbles view, also known as a bubble chart, is a means to show relational value without regards to axes. The bubbles are packed in as tightly as possible to make efficient use of space. There are a lot of different ways to use this information, particularly with a data set that uses a […]
Grappling with Data: The 2014 IBJJF Seattle International Open Visualized in Tableau

In this post, we’ll have a little fun with Brazilian Jiu-Jitsu or BJJ for short. I recently began training in BJJ at the Renzo Gracie Academy in Portland, OR. I feel very fortunate to have found a facility full of great people to be around, both on and off the mat. For those of you […]
What Tableau IS and IS NOT

During the Christmas holiday, I noticed this tweet from a friend, Paul Banoub: This frustration isn’t uncommon. About 25% of the clients I’ve worked with during the last seven years have underutilized Tableau initially because they didn’t use Tableau’s visual analytics (available via Show Me) to display information. What Tableau IS Tableau is a visual […]
Fixing a Jumpy Mouse in Windows Server 2012 R2 Remote Desktop
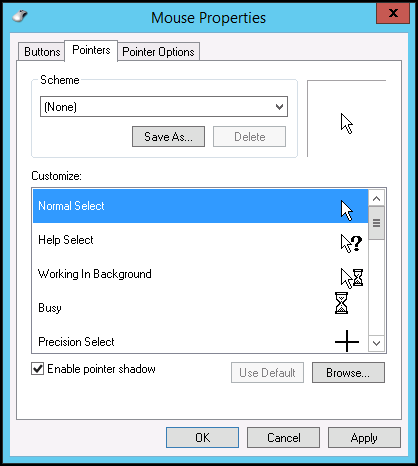
When remote-connecting to a Windows Server 2012 or 2012 R2 computer, I have noticed that the mouse movement on the screen is often jerky and frustrating! There is a very easy fix for this. Simply edit the Mouse Properties to disable pointer shadow. Go to: Control Panel > Hardware > Mouse Select the Pointers […]
Tableau Essentials: Chart Types – Bullet Graph
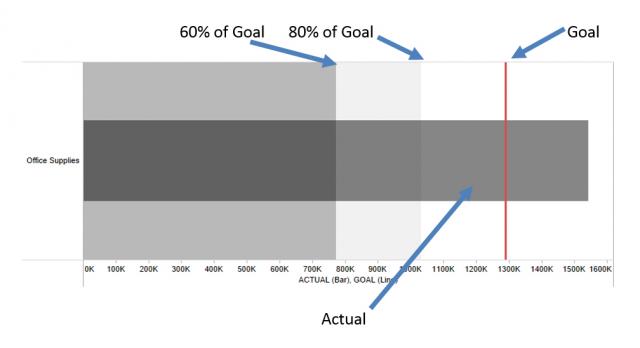
A bullet graph is a very powerful way to compare data against historical performance or pre-assigned thresholds. As you’ll see, we can include a lot of information in a small space with this type of chart that is also Tableau’s answer to those looking for a gauge or meter visualization. A bullet graph is similar […]
Our Tableau Vizmas Wish List: 16 Things Our Consultants Want This Year

With the holiday season well upon us, we can’t help but think of all the wonderful giving that’s going to take place in a few short days. But let’s face it, we’ve all pondered about what we’re going to get this year. Don’t tell me you haven’t been eyeing that $100 pair of monogrammed cashmere […]
3 Ways to Help Your Tableau Deployment

During the past year, I’ve given lots of speeches and spoken with hundreds of people that are using Tableau. Many are expanding their Tableau Server deployments. Most people want to know how to ensure success or improve the utilization of the tool. They want to know best practices or how to improve their own work […]
5 Benefits of DataGravity’s Groundbreaking Data-Aware Storage Platform
There’s a lot of buzz surrounding DataGravity lately, especially on the InterWorks blog. We’ve shared our in-depth Discovery Series blog series and even started creating Discovery Series Solution Shorts. That said, not everyone speaks tech. I thought it would be nice to share a high-level overview of data-aware storage from DataGravity. Data-aware storage, pioneered by DataGravity, […]
Tableau Essentials: Chart Types – Gantt Chart
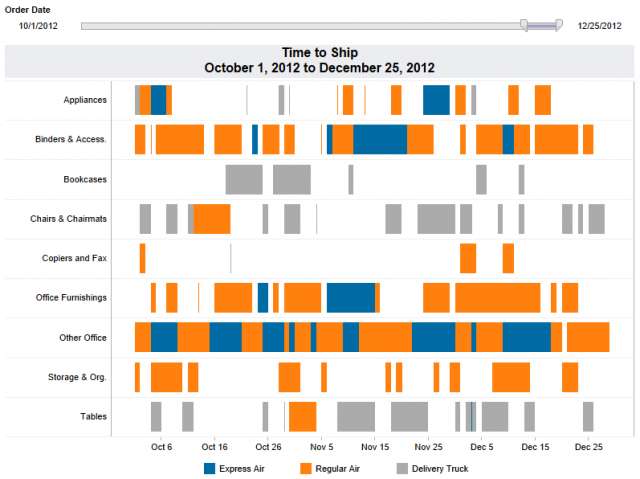
The Gantt chart was invented back in the 1910s by Mr. Henry Gantt as a way to visualize a schedule or progression of time. Since then, the Gantt chart has become a staple of project management methodology. Each task can be planned as an individual data point with interdependencies on other tasks and resources. You […]
Color Tool for Tableau: A Simpler Way to Create Custom Color Palettes

Tableau purchased Power Tools in 2019. Contact Us for more information. A lot has happened in the world of Power Tools for Tableau lately. Just last month, we announced the official addition of the Enterprise Deployment Tool for Tableau and Portals for Tableau. Those big-ticket items are more than enough to satisfy people, but we weren’t […]
