Visualizing Public Transportation Data from DIVVY in Chicago with Tableau 8.1

Data

Visualizing Public Transportation Data from DIVVY in Chicago with Tableau 8.1

by Tom McCullough
//

DIVVY Bike Share Program (http://divvybikes.com/about) sent out a cattle call for beautiful and informative data visualizations from their actual rider and bike databases. (http://divvybikes.com/datachallenge)

In my quick response, I took a look at the very basic output from the data with no reshaping or modelling. Even this basic report ended up being pretty interesting. For one, I love Chicago (have been there a few times as a Tableau Trainer).

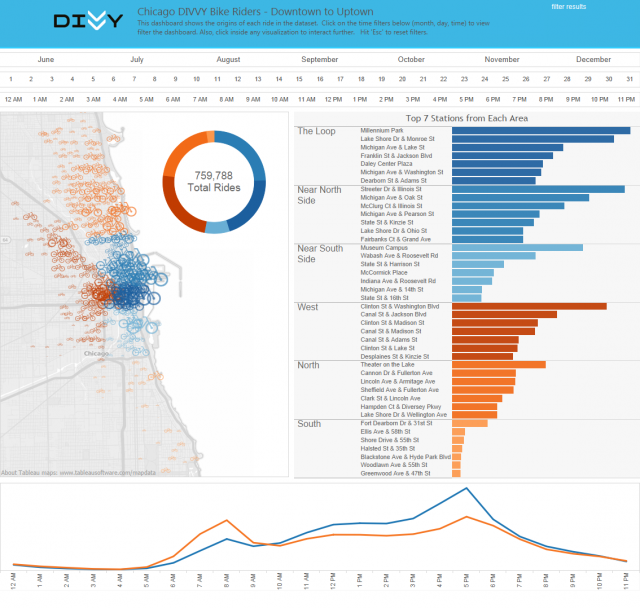
Secondly, it’s interesting how the majority of bikes move in and out of the downtown area, similar to a lung taking one day-long breath. Click through the hours timeline to see what I’m talking about.

There is definitely some rich data here to explore in the future. For now, here is the first glance. Click on the image below to interact.

Tableau 8.1 visualization of DIVVY.

More About the Author

Tom McCullough

Solutions Architect
5 Tableau Tabellenberechnungen, die Du kennen musst Berechnete Felder erlauben es, Felder zu vergleichen, zu aggregieren, Logik anzuwenden, Strings zu verketten, Datumsfelder zu ...
New Default Setting in Tableau Server 9.1 Will Break Embedded Dashboards If you embed your Tableau analytics dashboards through either a straight embedded i-frame or with the JavaScript API, upgrading your ...

See more from this author →

InterWorks uses cookies to allow us to better understand how the site is used. By continuing to use this site, you consent to this policy. Review Policy OK

×

Interworks GmbH
Ratinger Straße 9
40213 Düsseldorf
Germany
Geschäftsführer: Mel Stephenson

Kontaktaufnahme: markus@interworks.eu
Telefon: +49 (0)211 5408 5301

Amtsgericht Düsseldorf HRB 79752
UstldNr: DE 313 353 072

×

Love our blog? You should see our emails. Sign up for our newsletter!