
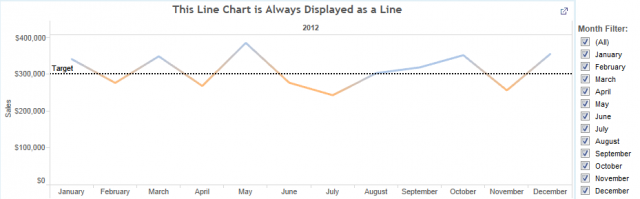
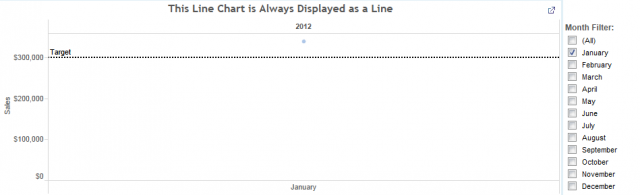
If you’re reading this post, you already know that the trend line is the gold standard when it comes to viewing data over time. However, the visual impact of a trend line plummets if the data are too thin. The images below highlight a common issue when using trend lines on interactive dashboards. The first example shows Sales as a trend line over 12 months. The second example shows the same chart filtered to display Sales for January only. Selecting a single month in the Month Filter results in a downright terrible viz. So, how do we fix the problem of a trendless trend line?
SIZE() to the rescue!
SIZE() is a table calculation that returns the number of records in the partition. Follow the steps below to dynamically replace your single mark line charts with a better visual option.
Step 1:
Create a calculated field named “Size Test” using the formula SIZE() > 1.
Step 2:
Place the “Size Test” calculated field on the filter shelf of your trend line chart and set the filter to True.
Step 3:
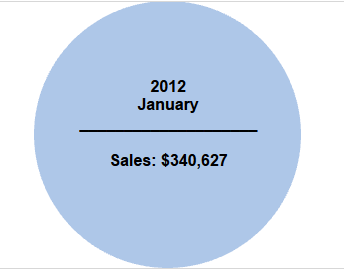
Build a viz that works well for displaying a single month of data. I typically use a large circle that maintains my color encoding rules. I label the circle with the same data that I display in the tooltip of the trend line chart.
Note: Although you’re not required to build a circle chart, you’ll still need to place the date field on the Columns Shelf at the same level of detail as your trend line chart in order for SIZE() to work its magic. In this case, I have YEAR(Order Date) + MONTH(Order Date) on the Columns Shelf.
Step 4:
Place the “Size Test” calculated field on the filter shelf of your circle chart and set the filter to False.
Step 5:
Place both charts in the same layout container on your dashboard and hide the titles. Make sure you are targeting both charts with the same date filter on your dashboard.
There you have it! Take a look at the attached workbook to see this method in action. As always, don’t hesitate to contact me directly with questions.