Would you like to use more than one view on a dashboard to filter data on a separate worksheet? There’s a solution for that which also prevents Tableau from automatically switching displays when selecting data on a dashboard view.
Once you have created the worksheets you want to use as filters and the worksheet you want the filters to apply to, follow the steps below.
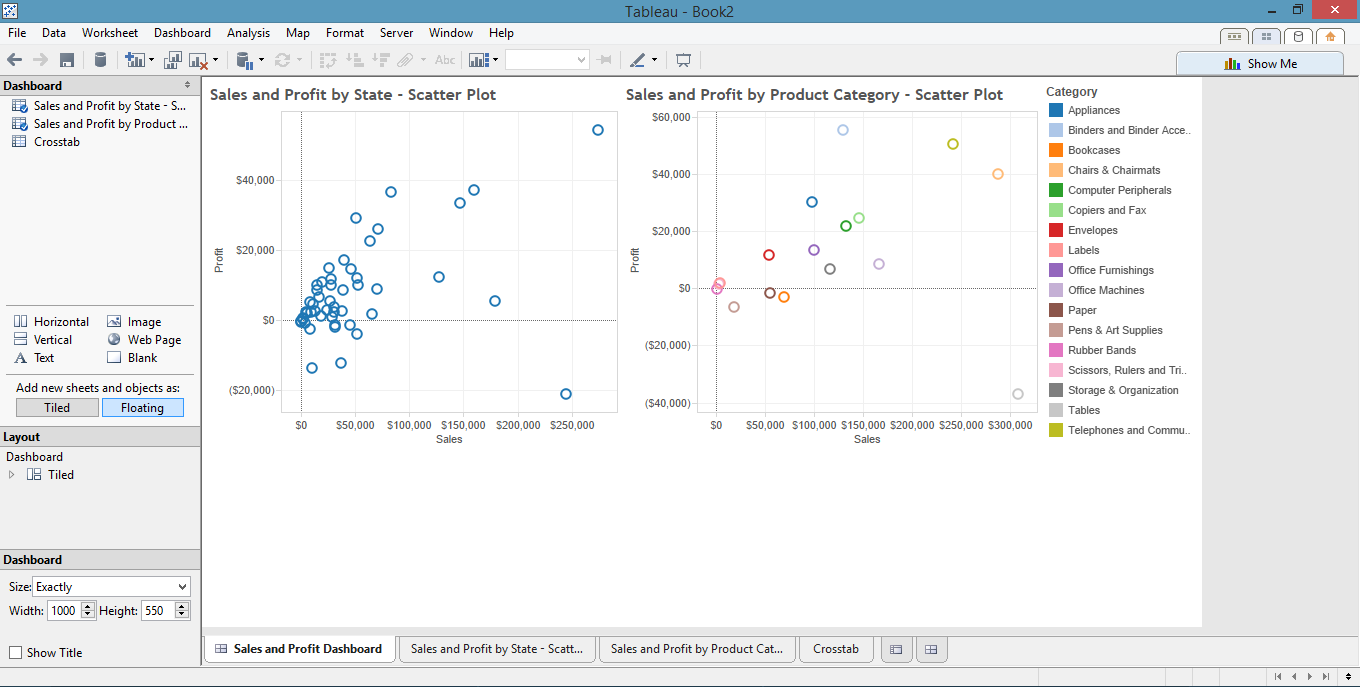
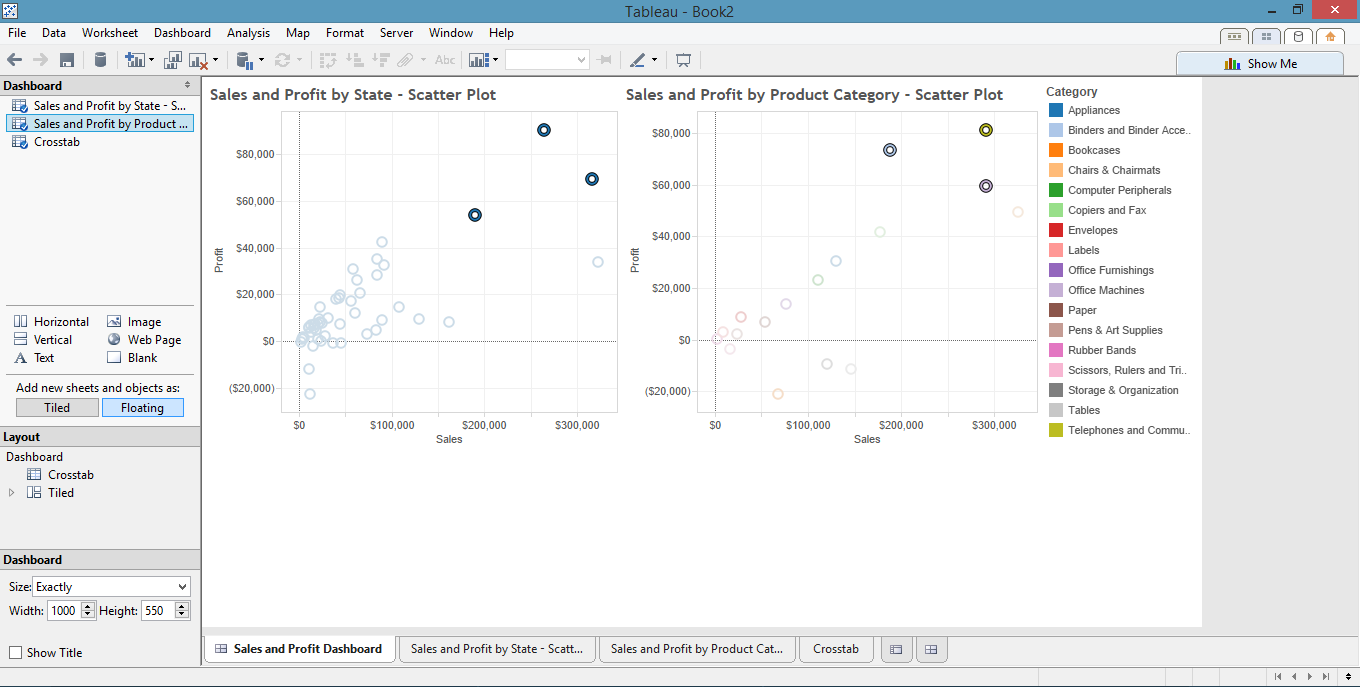
1. Add Views to Your Dashboard
I will use scatter plots for filtering. My dashboard currently contains two views. The first view shows sales and profit by state. The second view shows sales and profit by product category.
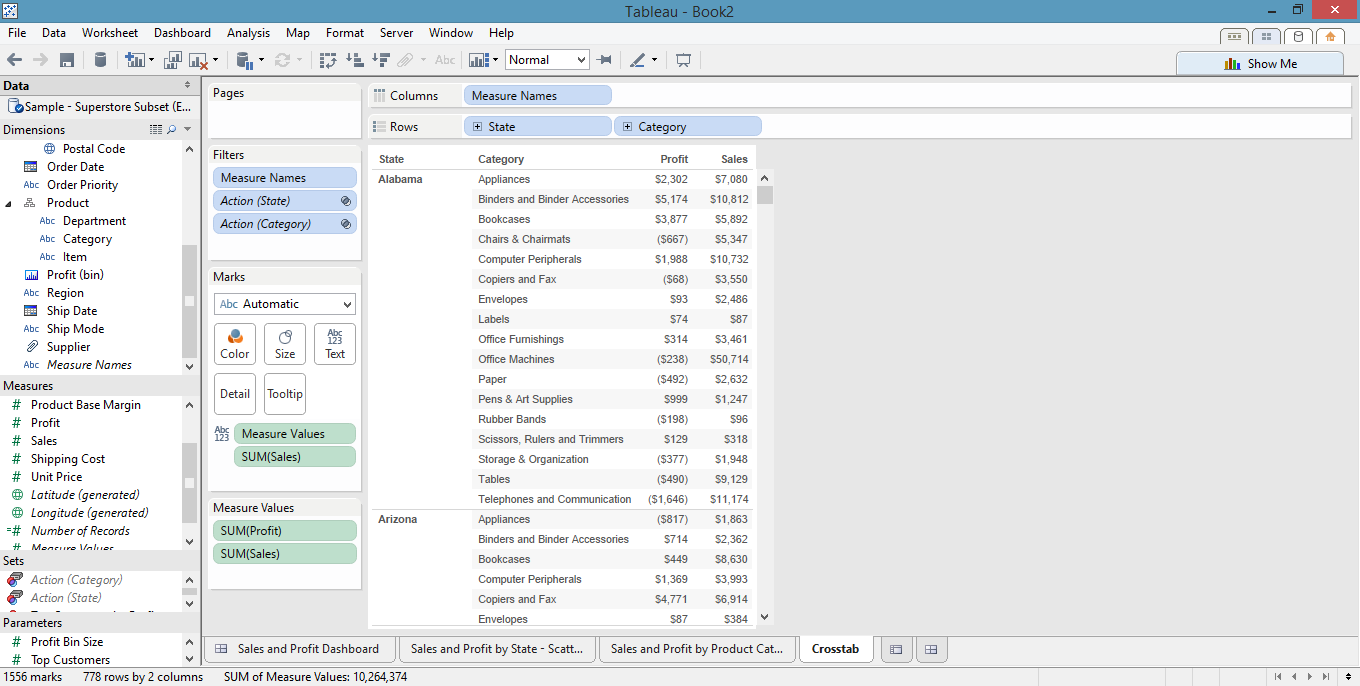
The third worksheet is a crosstab which displays sales and profits by state and product category. Currently, it is displaying data for all states and all product categories.
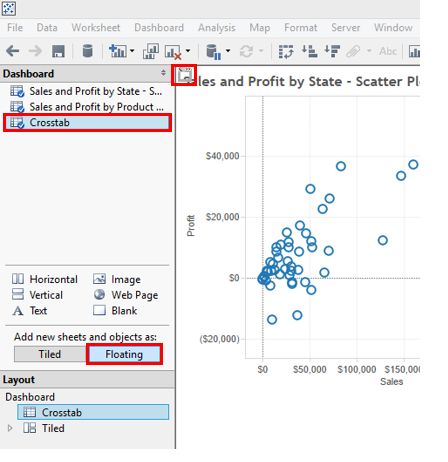
2. Add and Hide the Remaining Worksheet on the Dashboard
In order for the filters from the dashboard views to apply to the crosstab worksheet without changing the display automatically to the crosstab worksheet, you need to add the crosstab to the dashboard. You can hide it once you add it. Select “Floating,” drag the crosstab worksheet onto the dashboard, minimize it and then add it to the top-left corner, so it is hidden from the users who view the dashboard.
3. Add a Dashboard Action
On the menu toolbar, select Dashboard -> Actions. On the Actions box that appears, select Add Action -> Filters. Make sure the Source and Target Sheets are set to the current dashboard and all of the sheets are checked including the hidden crosstab view. Switch “Run action on:” to “Select” and “Clearing the selection will:” to “Show all values.” Click “OK” and return to the dashboard.

4. Filter Your Data
Select various data points on both of your visible dashboard views to filter your results.
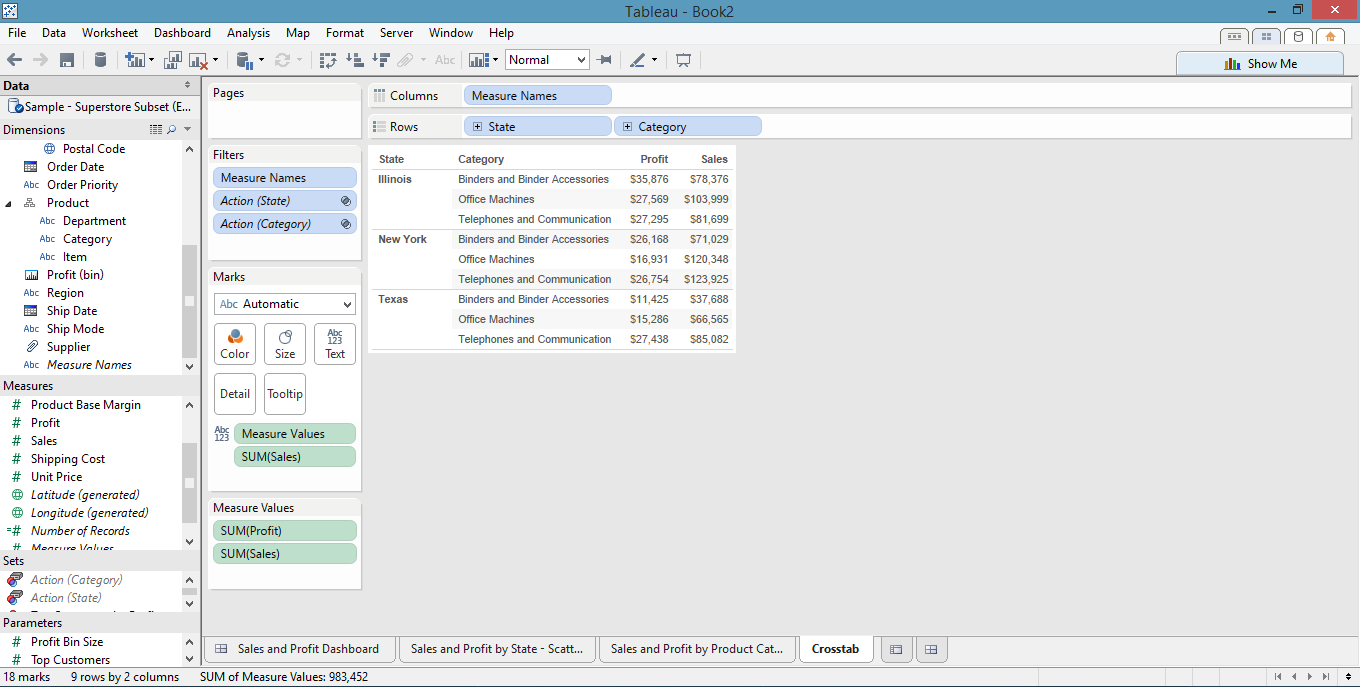
5. Switch to Your Crosstab Worksheet
Once data has been selected on the dashboard, verify your results have been filtered on your third worksheet. Below you can see that three states and three product categories have been selected as shown above in the scatterplots.