Advance with Assist shares quick solutions to common challenges encountered by the InterWorks Assist on-demand team.
Question: I need to add more than 16 columns to my sheet. How is this possible?
Let me start by saying that this is not recommended by InterWorks. If we are using this many rows or columns to create a crosstab view, there is likely a better software available for the task or a better way to visualize the data in Tableau itself. That being said, we see this when clients are tooling Tableau to mimic an Excel spreadsheet or craft a simple text view to be distributed on a printout.
What is Currently Possible in Tableau
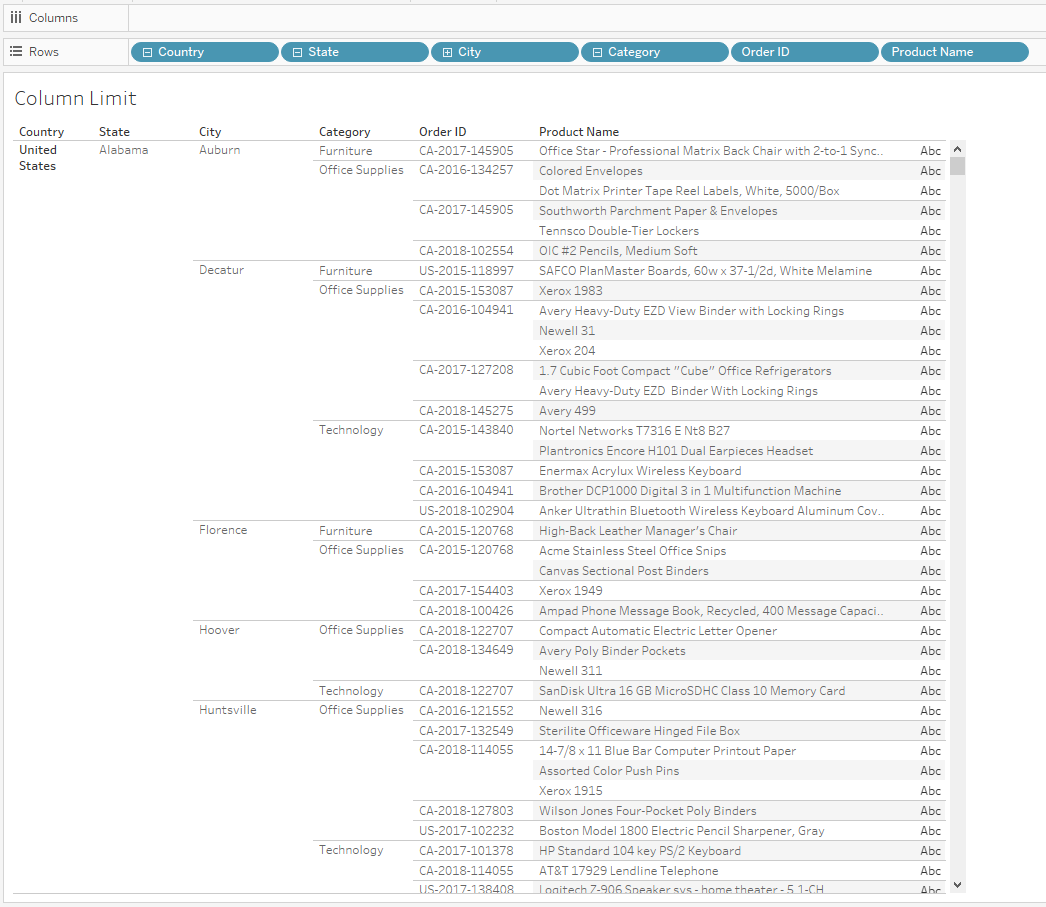
Tableau typically only allows six dimensions across our Rows in a view like the one below:

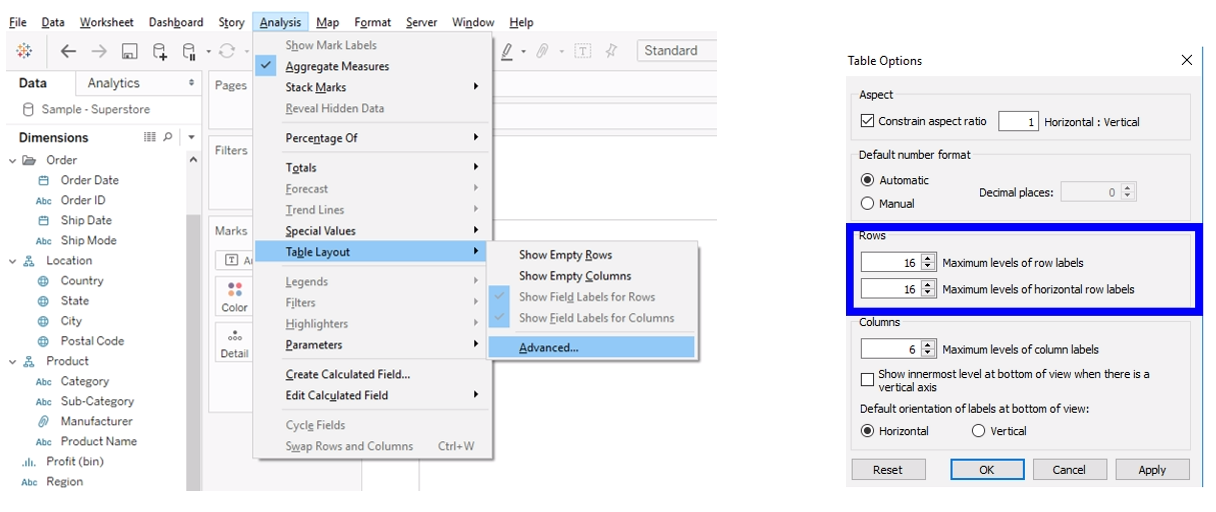
I can change this to allow up to 16 dimensions from Analysis > Table Layout > Advanced:

Two Ways to Exceed Tableau’s Column Limit
The first comes from a 2015 Tableau Conference session called “Use Tableau Like a Sith.”
Step 1: After going to Analysis >Table Layout > Advanced and changing the number in Rows and/or Columns to 16, save your workbook as a .twb.
Step 2: Open this file in Notepad.
Step 3: Search for the text: attr=’row-levels’.
- <format attr=’row-levels’ value=’16’ />
- <format attr=’row-horiz-levels’ value=’16’ />
Change the value of 16 to however many rows or columns you need.
Step 4: Save the Notepad file.
Step 5: Re-open your workbook in Tableau.
The second way is what some Tableau users call the Forklift method. Essentially, we will be using axes to trick Tableau into giving us more locations to place data fields.
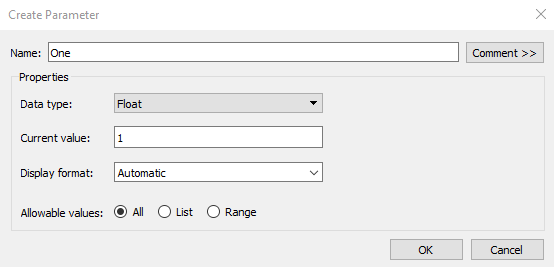
Step 1: Create a parameter with a float value of 1. These are the default settings. Keep these:

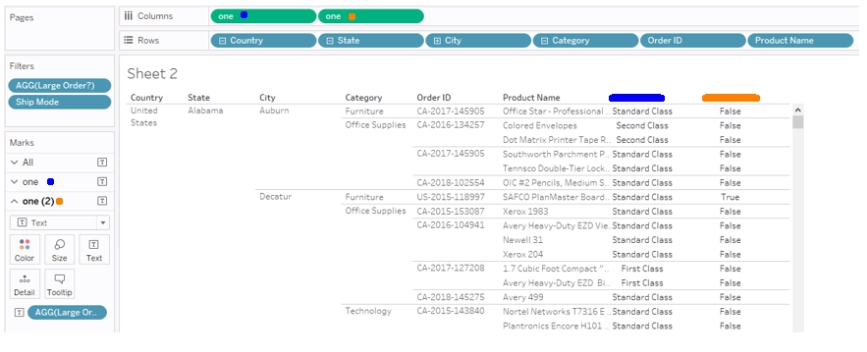
Step 2: Place this field on Columns for however many extra columns you need to add.
Step 3: Use the Marks cards to place separate fields onto Text separate Marks. Switch the Mark Type to Text:
 Step 4: Right-click the axis at the bottom to Edit Axis. Change the ranges to be Fixed for each axis. The field will always be displayed at the value of 1.
- For left-justified, try a range of 0 to 3
- For centered, 0 to 2
- For right-justified, 0 to 1.6
When done, hide the axes by right-clicking and unchecking Show Header.
Step 5: Finalize the formatting by removing grid lines, zero lines and any borders you don’t want.
- Right-click in the sheet and select Format, or use the Format drop-down menu from the top of the window.
Managing Multiple Axes Instances
It is possible to manage many instances of these axes, depending on the size of your monitor. I could fit 55 different Marks cards on my monitor; with the 16-field limit, that got me to a total of 71 columns. Each axis would have to be individually given a range, and each field would have to be placed on its respective Marks card, so managing this method is labor intensive.
To reiterate, it is not recommended to use Tableau in this way, but this is a stretch solution for those times when it is unavoidable.

