
The Portals for Tableau New Features series is designed to keep users up to date with all the latest features being added to InterWorks' embedded analytics solution, Portals for Tableau.
Please note that Portals for Tableau are now officially known as Curator by InterWorks. You can learn more at the official Curator website.
I’m going to let you in on a little known fact: Scientists have very recently discovered that a picture is worth a thousand words. When it comes to tutorials, you can either use your thousand words to describe each part of a dashboard, or you can use the new highlight image functionality to build guided tutorials. The choice is yours, but with the popularity of TL;DR (too long; didn’t read) summaries on long articles, I’d lean toward using the feature if I were you.
Using my own advice, instead of typing out a long description of what the guided tutorial functionality can do, I’ll save my aching fingertips and show a simple visual demonstration of it in action:
To learn how to create a guided tutorial, here’s a guided tutorial:
The Step-by-Step Guided Tutorial Process
Here are the steps for those who like to read:
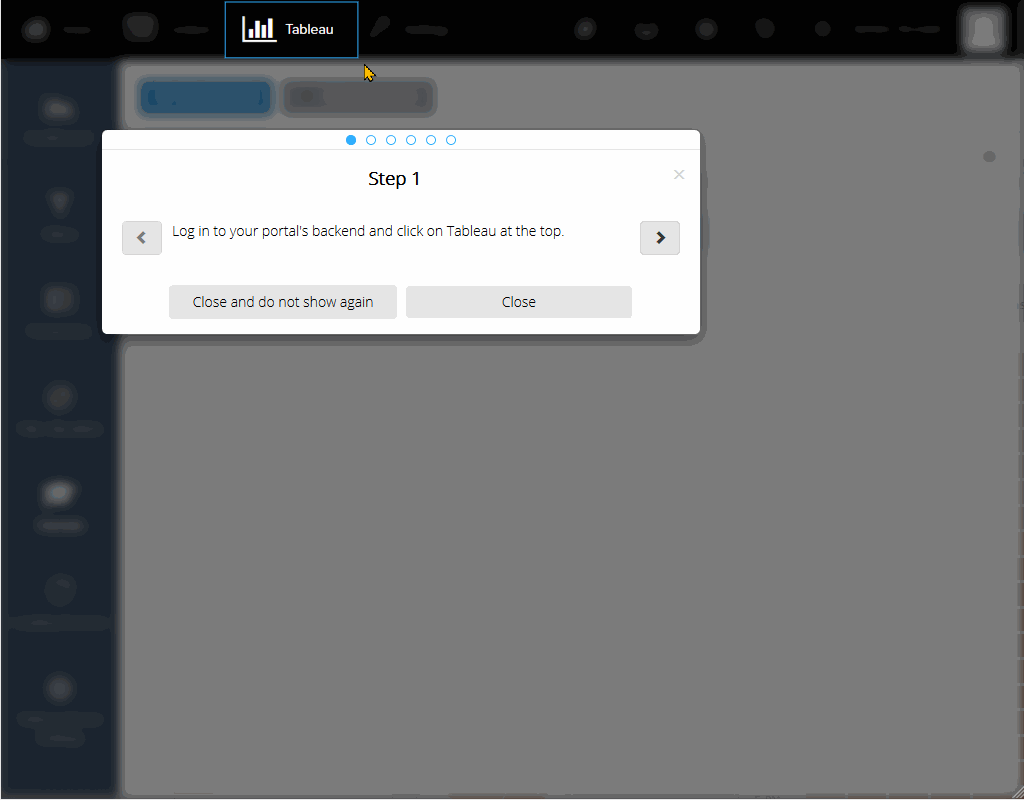
- Log in to your portal’s backend and click on Tableau at the top.
- On the left, click on Tutorials.
- Click on the button at the top to add a new tutorial.
- Fill in the various details at the top, and then click on the button to add a new section. Each section will display as a new page of the guided tutorial.
- Fill in the details for the section, and select a screenshot to use as your highlight image. Please note that you’ll need to create this screenshot and upload it to the Backend > Content > Files area if you haven’t already done so.
- Use your mouse to draw a square on the preview image. This square will be used as the highlighted portion of the screenshot.
- Repeat steps 4 through 6 for each page of your guided tutorials. Once you’re happy with it, click the Create button at the bottom, and add it to the dashboard under the dashboard’s Misc tab.