Portals for Tableau 101 shares the basics of interacting with InterWorks' embedded analytics solution, Portals for Tableau.
Please note that Portals for Tableau are now officially known as Curator by InterWorks. You can learn more at the official Curator website.
One of the biggest selling points for Portals for Tableau is how feature-rich and flexible it is. Portals for Tableau supports numerous versions of Tableau Server, Tableau Online and Tableau Public; multiple sites within a Tableau Server; a bunch of authentication methods and SAML identity providers; lots of web server platforms; tons of dashboard features; and a myriad of portal theme and configuration options. That’s a lot of moving parts.
When Things Go Wrong
While we do our best to have the portal run flawlessly regardless of your environment, sometimes things just don’t work like they should. Occasionally, it’s the portal’s fault, but other times, it’s some other component specific to your setup. Nevertheless, the root cause of the issue needs to be found and fixed as quickly as possible.
If you ever find yourself with some feature of the portal not behaving like it should and throwing a tantrum, it can be overwhelming trying to pinpoint where the issue might lie. Your first step should be to reach out to Assist by InterWorks (or use the backend Contact Us form to report the issue). However, if we can’t immediately identify the cause based on the behavior or error message, we may need a little more information. Often, we can get that additional information by switching your portal into debug mode, recreating the scenario that caused the problem and then looking through the debug logs for the culprit.
If we can access your portal directly, we can do that ourselves. However, many portals are locked away behind a firewall. In those cases, we’ll have to rely on you to perform those steps. This post will outline the steps you’ll need to take to send us those logs.
Process for Providing Debug Logs
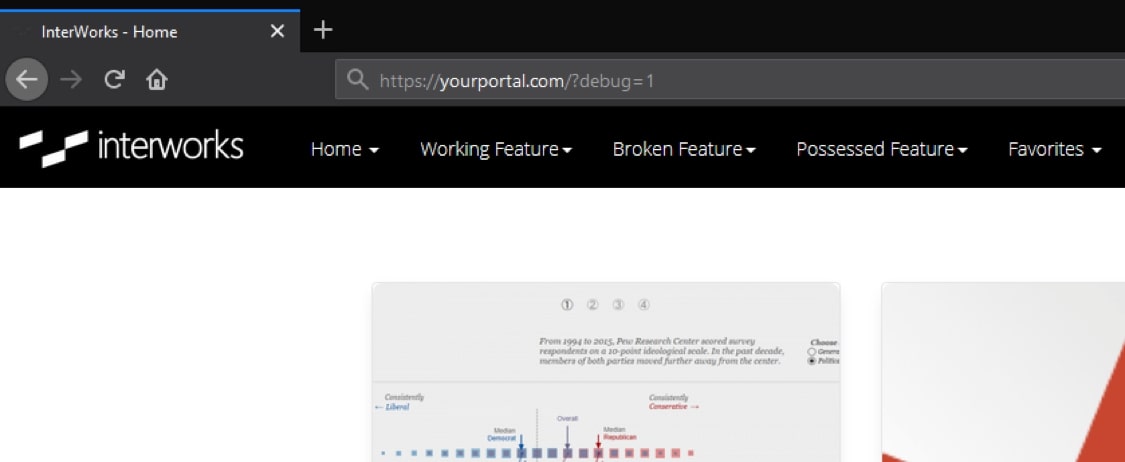
The first step is to tell the portal to turn on debug logging. To do so, you’ll need to log in to your portal’s frontend. Once logged in, add ?debug=1 to the end of the URL in your browser. However, if you already had a question mark in the URL, then add &debug=1 instead. Hit enter to load the page and start debug mode. You’ll notice a new toolbar at the bottom of the screen. Ignore it for now:

Next, recreate the issue you’re experiencing. This could mean navigating to another page or clicking a button. There might even be multiple steps you’ll need to perform to make it happen again. Whatever the case, the goal here is to break it in the same way you saw it broken before.
Pass Along the Debug Logs
After the portal throws its tantrum again, the next step is to download the debug logs and send them to us. Now, it is time to turn your focus to that new toolbar that appeared at the bottom of the screen on the frontend. This will provide the debugging information we need to troubleshoot. Within that toolbar is a button to export the logs to a file. It should be located on the right side of the toolbar. Once you find it, go ahead and click that button, save the file it gives you, email it to us, and rest easy that we are diligently working behind the scenes to find a fix for the glitch:

