Portals for Tableau 101 shares the basics of interacting with InterWorks' embedded analytics solution, Portals for Tableau.
Please note that Portals for Tableau are now officially known as Curator by InterWorks. You can learn more at the official Curator website.
Are you so accustomed to sharing your insightful opinions on the day’s biggest headlines via Facebook comments that it just irks you not to be able to with your company’s Tableau dashboard? Well, the days of being unheard are over because Portals for Tableau supports inline commenting! This post will cover how to set this up on a dashboard for your Portals instance. Hold your comments until the end.
Before you begin, make sure you have Tableau Desktop, Tableau Server and Portals for Tableau. If you don’t have those things, feel free to continue reading to get an idea of the possible benefits for your business!
It’s helpful to know what is going on in the background when configuring this. What we’re going to do is tell your portal that we want comments to be available. This will set up a table in the Server database that we can then blend with our dashboard in Tableau and set as a tooltip. After the setup is complete, when a comment is made on the dashboard, it will update the table, which will then update the dashboard with the comment. It sounds magical, I know, but have patience, young Jedi. This post will guide you.
The first thing you need for inline comments is something to comment on! Set up a dashboard with the metrics you would like to open up for comments. The example below includes various business metrics involving the market share for our (fictional) clothing brand, The Notch:
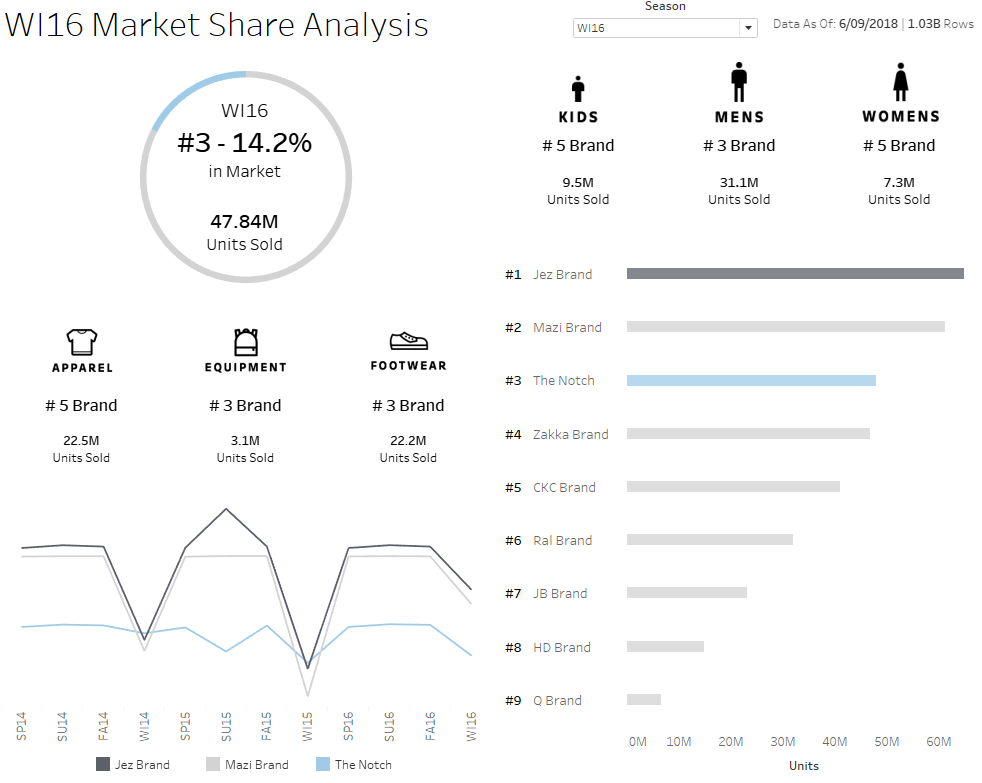
We are going to use the line chart in the bottom-left corner as an example. This way, our (fictional) executives can make comments on the trends they see over time directly in the dashboard. This means that the Season dimension (the columns of our line chart) will be what the comment is attached to. Don’t push the dashboard to your Server just yet; we have some more setup to do.
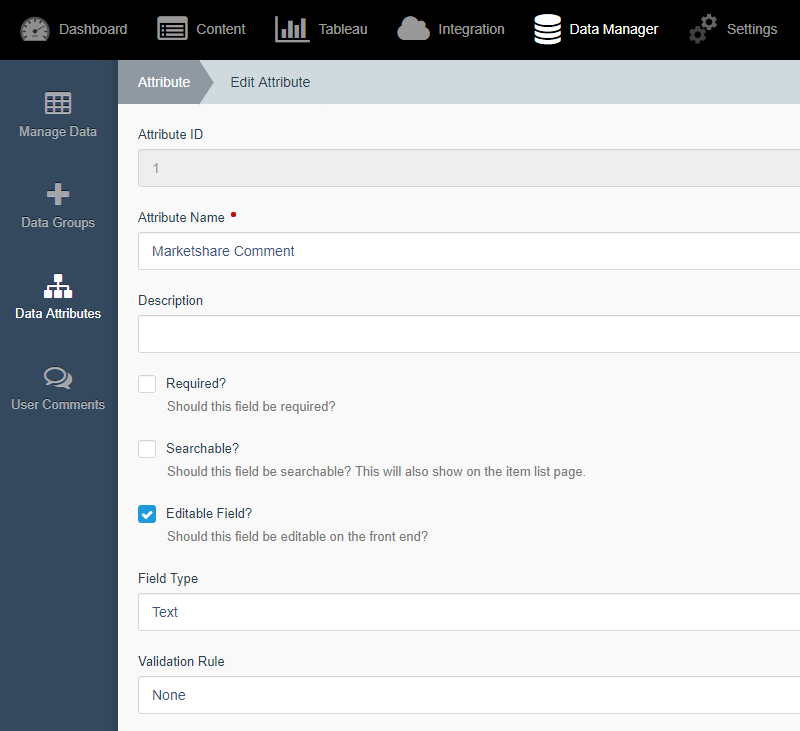
Let’s get the portal ready for commenting now. Navigate to the backend of your portal. Go to the Data Manager (top menu) and then to Data Attribute (left menu). Click the New Attribute button and give your comments a name (ours is Marketshare Comments). There’s no need to give this a description—just make sure the Editable Field? box is checked while the Required? and Searchable? boxes are not. Additionally, make sure that the Field Type is text with no Validation Rule:
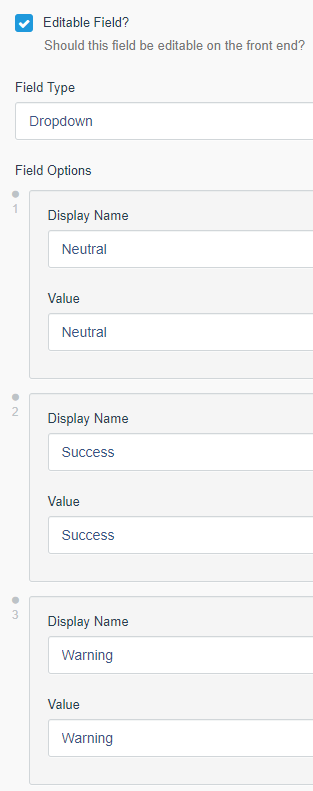
We also wanted to provide a status component to the comments, so we created another attribute called Marketshare Comment Status. This setup is the same, except we made it a drop-down Field Type with three values. For simplicity, our Display Name is the same as the Value:
Now go to Data Groups (left menu) and click the New Group button. Name the group and select the attribute(s) you created for commenting. Ours is named Marketshare Comments:
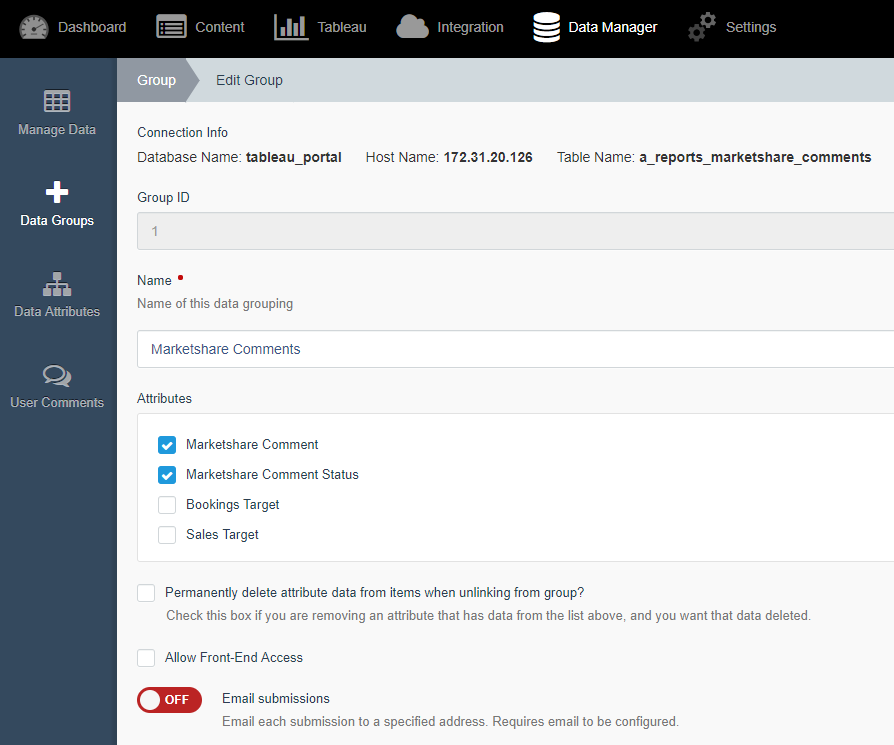
Once this Data Group is saved, our portal will create the table in the database associated with our portal’s Server. You can see at the top of the data group page that our table name is a_reports_marketshare_comments.
Let’s get the dashboard into the Portal. In the backend of the portal, go to the Content (top menu) settings, then go to the Dashboards (left menu) page. Here, you can select the New Dashboard button and choose the dashboard you just exported to the Server. After choosing the site, workbook and sheet, the title, URL and slug will automatically fill. You can move on to the Misc and Advanced tabs to set a thumbnail, create a loading screen, insert custom JavaScript snippets and add other features.
Now we can complete the loop. Go to the Mark Commenting tab that’s right after the Advanced tab. Here, we will select the Data Manager Group, which is the Data Group that built the table holding our comments and the field that the comments will attach to. Under Data Manager Group, select the Data Group we created earlier that contains the comment attributes. Then, under Mark Details, choose Add New Item and input the dimension the comments will attach to (ours is Season).
Note: Make sure the spelling matches the dimension name from your dashboard:
![Filter [Marketshare Comment]](https://interworks.com/wp-content/uploads/2018/10/Inline4.png)
Now, go to the Nav Menu (left menu) and make sure there is a menu link to the dashboard (create one if there isn’t).
Go to the front end of your portal and navigate to the page your dashboard is on. You should see a neat modal popup that tells you the dashboard is configured to capture user comments:
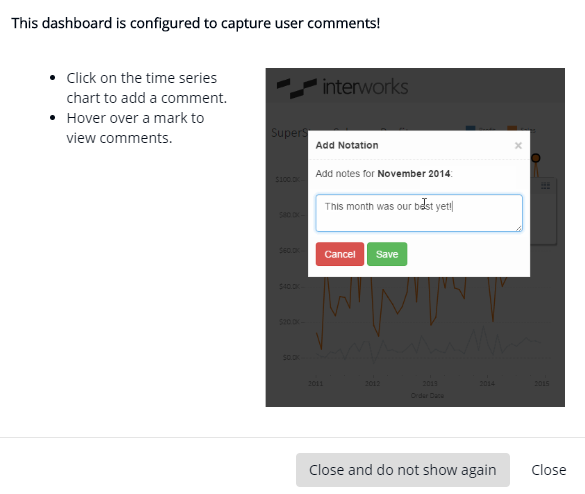
Add a quick “test” comment so we can be sure everything works. It won’t show up here just yet, but once we blend the comments table mentioned before with our dashboard, we’ll be good to go!
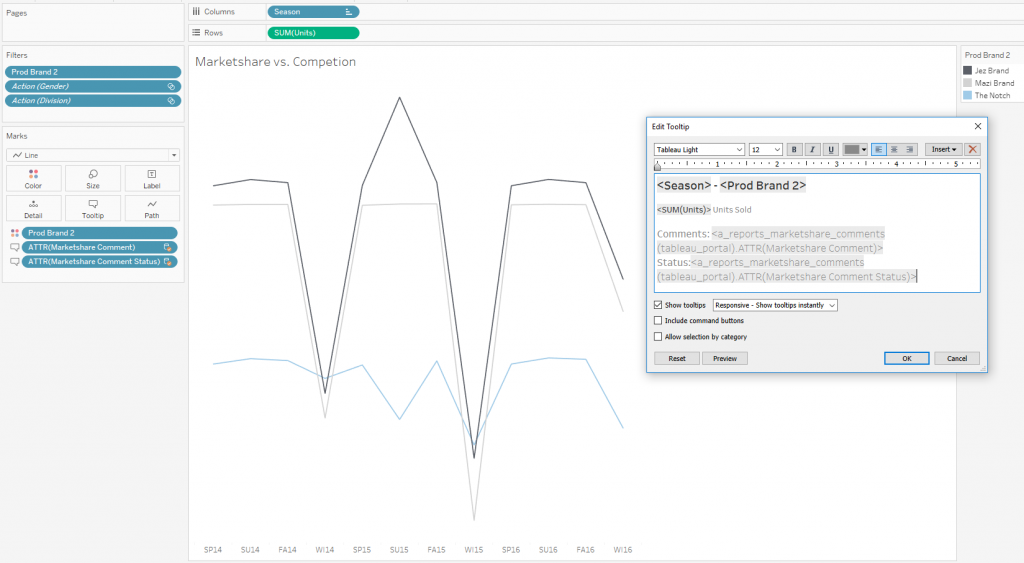
This means we are ready to blend the table with our Tableau dashboard! Back in Tableau, go to the specific sheet within the dashboard that will be commented on. Ours is that line chart showing the market share for The Notch and its biggest competitors. Once you’re on the sheet, use the Data menu (top menu next to File) and select New Data Source. If you’re a hot-key kind of person, you can also use CTRL+D. Choose MySQLServer, connect to the MySQL database that the table is stored in, then choose the name of the table generated by the portal. Your Portal server administrator can create a username and password for this database if you do not already have one.
Once the connection is made, return to the sheet. Use the Data menu again and choose Edit Relationships. Make sure the primary data source is the one that the sheet is built off of (it should automatically), and choose the table you just connected as the secondary data source. You’ll know they have been properly blended once you’ve added the fields if the primary data source has a blue check and the secondary has an orange check in the Data menu on the left.
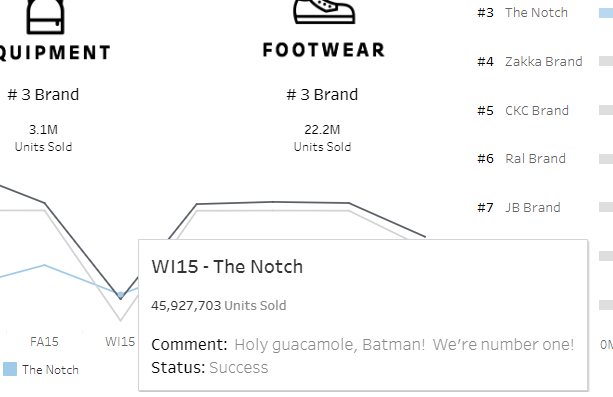
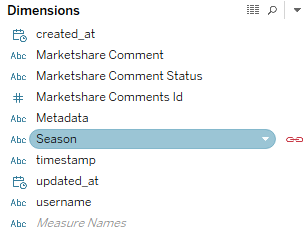
We’re almost there! The excitement is palpable. Now that the blend has been made, we have to display the comments on the sheet. Our example is going to have them in a tooltip, so you can see any comments made just by hovering over the line. Choose the secondary data source under Data (left menu), and you’ll see a few dimensions (the comments have to be a dimension), including the attribute(s) we created before. We attached the Marketshare Comment and Marketshare Comment Status dimensions to our tooltip card and formatted the tooltip (double-click the tooltip marks card) to look nice and fancy:
Unfortunately, if you have multiple comments, the blend doesn’t know which comment to use. We have a fix for that, though! Simply drag the Marketshare Comment (or whatever you named yours) to the Filters pane. Select Use All under the General tab, then go to the Condition tab, select By formula and paste this code:
MAX([created_at]) == MAX({ FIXED [Season] : MAX([created_at])})
Replace the [Season] field with the field you’re blending on (created_at is generated by the portal, so that field will have the same name). What’s happening here, though? We’re aggregating the value on the left only because you must aggregate or not aggregate each value in a conditional; it’s really only the specific row’s created_at field. The right value is finding the latest created_at value per season. So, the conditional is looking at the current row’s created_at and comparing it with the created_at from the latest comment that has the same season, thus filtering out all the older comments.
Go to your dashboard and make sure the tooltip looks as wonderful as you like, then push the workbook to your Tableau Server that is connected to the portal.
All done!
Now, all you have to do is select a mark on the chart you set comments up for, and you’ll get a pop-up asking for your comment:
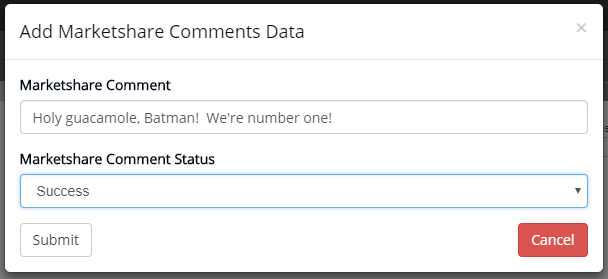
Fill out that form, and bada bing, bada boom—you have yourself a live comment!