Tableau Essentials: Chart Types – Treemap

Data

Tableau Essentials: Chart Types – Treemap

Not everyone is a Tableau guru, at least not yet. To help Tableau rookies, we’re starting from square one with the Tableau Essentials blog series. The series is intended to be an easy-to-read reference on the basics of using Tableau Software, particularly Tableau Desktop. Since there are so many cool features to cover in Tableau, the series will include several different posts.

Treemaps are a relatively new feature to Tableau, first appearing in version 8.0. They are very powerful visualizations, particularly for illustrating hierarchical (tree-structured) data and part-to-whole relationships. Because of their visual nature, treemapping is ideal for legibly showing hundreds or even thousands of items in a single visualization simultaneously. 
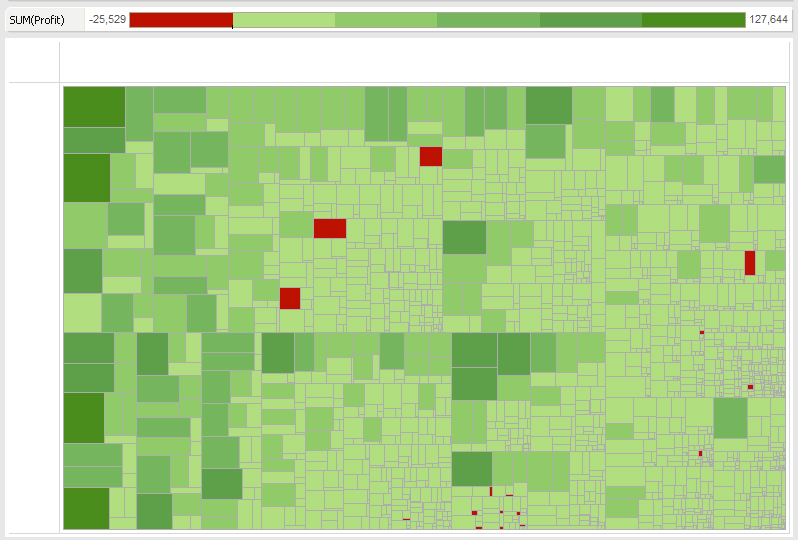
Treemap

Figure 1: Treemap.

The example provided above (Figure 1) shows a treemap visualization examining sales (size) and profit (color) of product categories by department at the country and state-level. The most profitable nodes are dark green. The non-profitable segments are grouped in red. There are thousands of marks in this visualization, but your eyes are automatically attracted to the red islands in a sea of green. The larger the red mark, the more concerning it is for the business. That’s because these areas are generating sufficient sales but still aren’t making money.

If you mouse over the largest red mark or node, the tooltip provides more detailed information:  

Treemap tooltip

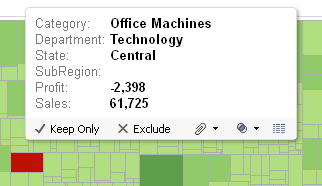
Figure 2: Treemap tooltip.

Using a treemap, you can immediately show the “landscape” of performance with this visualization. This view is very similar to a heat map, but the nodes are gathered by like kind in the hierarchy of dimensions you have defined. In the case of Figure 1, they are: Department > Subregion > State > Category.

There’s a lot more you can do too with a little bit of imagination. For an example of the exciting stuff you can do with a treemap, check out this horizontal bar chart where the bars are both individual treemaps.

The interactive nature of Tableau Software makes a simple treemap into a powerful tool in the hands of a user, because they can drill down very quickly to the essential points of the “story” told by the data. Experiment and try new things. Don’t be afraid to make mistakes. The Undo button is there for that very purpose.

Other Chart Types

Here is the complete list of chart types from the Show Me menu. Be sure to check back often as we continue to release new articles in each chart type in this sub-series.

Introduction

  1. Text Table (Crosstab)
  2. Heat Map
  3. Highlight Table
  4. Symbol Map
  5. Filled Map
  6. Pie Chart
  7. Horizontal Bar Chart
  8. Stacked Bar Chart
  9. Side-by-Side Bar Chart
  10. Treemap
  11. Circle View
  12. Side-by-Side Circle View
  13. Line Charts (Continuous & Discrete)
  14. Dual-Line Chart (Non-Synchronized)
  15. Area Charts (Continuous & Discrete)
  16. Scatter Plot
  17. Histogram
  18. Box-and-Whisker Plot
  19. Gantt Chart
  20. Bullet Graph
  21. Packed Bubbles

More Tableau Essentials

Want to learn more about Tableau? We have several posts outlining all of Tableau’s fantastic features. Check out the full list on our Tableau Essentials blog channel.

As always, let us know if you have any questions or comments about this post or Tableau in general. If you’re looking for personalized training or help with something bigger, contact us directly!

Contact Us

Want More Tableau Essentials

  1. Tableau Essentials: Chart Types – Introduction
  2. Tableau Essentials: Chart Types – The Text Table
  3. Tableau Essentials: Chart Types – Heat Map
  4. Tableau Essentials: Chart Types – Highlight Table
  5. Tableau Essentials: Chart Types – Symbol Map
  6. Tableau Essentials: Chart Types – Filled Map
  7. Tableau Essentials: Chart Types – Pie Chart
  8. Tableau Essentials: Chart Types – Horizontal Bar Chart
  9. Tableau Essentials: Chart Types – Stacked Bar Chart
  10. Tableau Essentials: Chart Types – Side-by-Side Bar Chart
  11. Tableau Essentials: Chart Types – Treemap
  12. Tableau Essentials: Chart Types – Circle View
  13. Tableau Essentials: Chart Types – Side-by-Side Circle View
  14. Tableau Essentials: Chart Types – Line Charts (Continuous & Discrete)
  15. Tableau Essentials: Chart Types – Dual-Line Chart (Non-Synchronized)
  16. Tableau Essentials: Chart Types – Area Charts (Continuous & Discrete)
  17. Tableau Essentials: Chart Types – Scatter Plot
  18. Tableau Essentials: Chart Types – Histogram
  19. Tableau Essentials: Chart Types – Box-and-Whisker Plot
  20. Tableau Essentials: Chart Types – Gantt Chart
  21. Tableau Essentials: Chart Types – Bullet Graph
  22. Tableau Essentials: Chart Types – Packed Bubbles
  23. Tableau Essentials: Formatting Tips – Introduction
  24. Tableau Essentials: Formatting Tips – Custom Shapes
  25. Tableau Essentials: Formatting Tips – Labels
  26. Tableau Essentials: Formatting Tips – Color
  27. Tableau Essentials: Formatting Tips – Tooltips
  28. Tableau Essentials: Formatting Tips – Maps
  29. Tableau Essentials: Calculated Fields – Introduction
  30. Tableau Essentials: Calculated Fields – Logical Functions
  31. Tableau Essentials: Calculated Fields – Number Functions
  32. Tableau Essentials: Calculated Fields – Date Functions
  33. Tableau Essentials: Calculated Fields – String Functions
  34. Tableau Essentials: Calculated Fields – Type Conversion
  35. Tableau Essentials: Calculated Fields – Aggregate Functions
  36. Tableau Essentials: Calculated Fields – User Functions

More About the Author

Robert Curtis

Managing Director, APAC
Building Solutions with InterWorks at Corinium’s Data Architecture Conference in Melbourne InterWorks was a proud sponsor of the Data Architecture Conference hosted by Corinium in Melbourne on 21 and 22 June 2023. Hundreds of ...
Virtual Event Recap: Deep Dive of Tableau Parameters For our June Lunch and Learn, we did a deep dive on parameters for our friends across Australia and Singapore. Tableau is the premier ...

See more from this author →

InterWorks uses cookies to allow us to better understand how the site is used. By continuing to use this site, you consent to this policy. Review Policy OK

×

Interworks GmbH
Ratinger Straße 9
40213 Düsseldorf
Germany
Geschäftsführer: Mel Stephenson

Kontaktaufnahme: markus@interworks.eu
Telefon: +49 (0)211 5408 5301

Amtsgericht Düsseldorf HRB 79752
UstldNr: DE 313 353 072

×

Love our blog? You should see our emails. Sign up for our newsletter!