Tableau Essentials: Chart Types – Pie Chart

Data

Tableau Essentials: Chart Types – Pie Chart

Not everyone is a Tableau guru, at least not yet. To help Tableau rookies, we’re starting from square one with the Tableau Essentials blog series. The series is intended to be an easy-to-read reference on the basics of using Tableau Software, particularly Tableau Desktop. Since there are so many cool features to cover in Tableau, the series will include several different posts.

Pie charts are among the most popular, if terribly overused, charts in business presentations. They are best suited to show proportional or percentage relationships. When used in the right circumstance, pie charts can quickly show relative value to the other data points in the measure.

Figure 1: Pie chart 

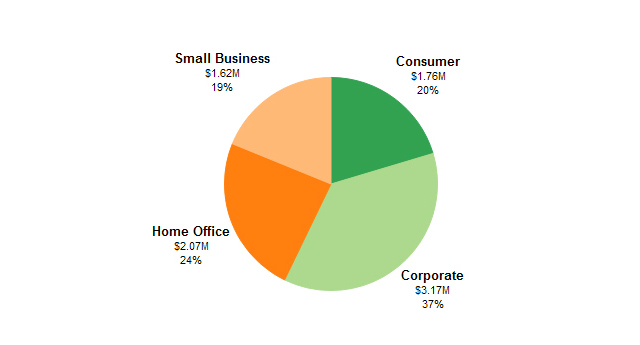
Figure 1: Pie chart.

The example above shows the pie slice for each of the departmental sales for our fictional company. With only four categories, the pie chart is clear, concise and has labels that are easily positioned for clarity. So, what’s the big problem?

Most data specialists strongly encourage you to use the famous pie chart selectively. For instance, if your worksheet has multiple categories, such as all fifty states, you’ll find that the pie chart becomes so encumbered with marks that it ceases to have much visual value. Take a look at this monstrosity:

Figure 2: Pie chart woe  

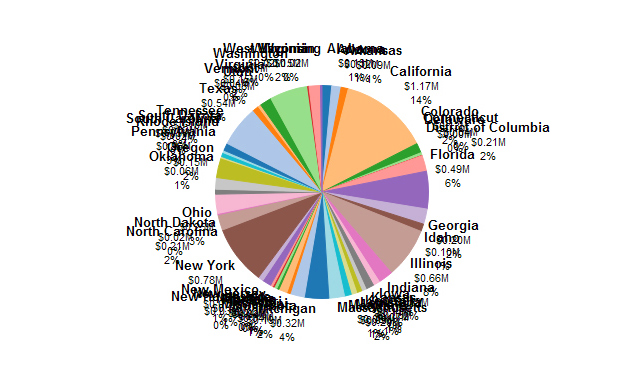
Figure 2: Pie chart woe.

The only thing you can even begin to discern from the pie chart above is that California, New York and what appears to be Illinois are big performers. The rest is a jumble of overlapping labels and every color in the spectrum. Even if I didn’t include the labels to exaggerate the point, good luck trying to match up the six different pastel shades of blue to a legend of 50 states.

The above example would be much better served in a different mark type, such as a horizontal bar chart that is sorted from highest to lowest.

Figure 3: Horizontal bar chart 

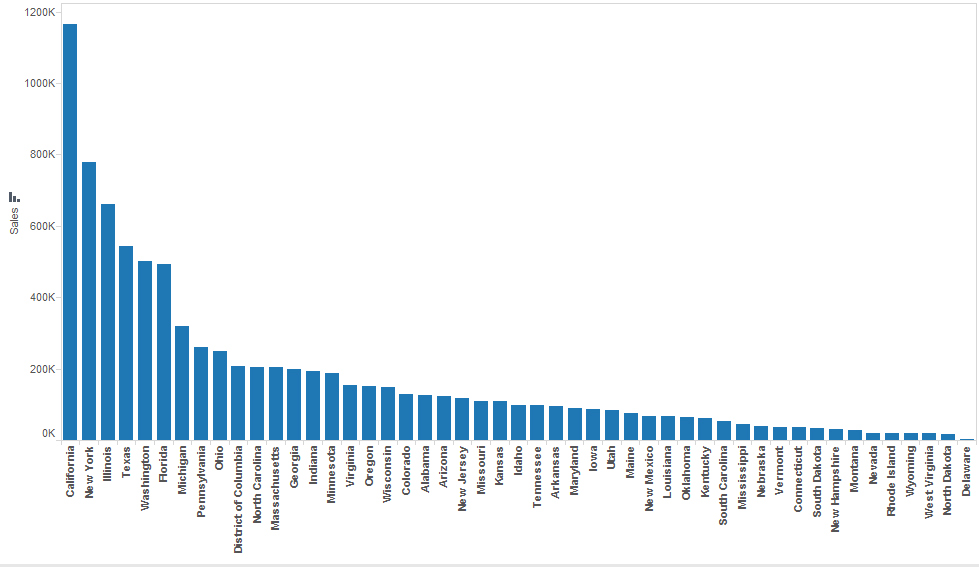
Figure 3: Horizontal bar chart.

Isn’t that 100 times easier to digest?

Just like you wouldn’t use a wrench to hammer a nail, make sure you don’t use a pie chart to present 300 data points. The pie chart’s shortcoming is perhaps the best way to show that all chart types have value, so long as they best convey the “story” behind the data.

Ultimately, it’s the goal of any data visualization to convey meaningful, actionable insight.

Other Chart Types

Here is the complete list of chart types from the Show Me menu. Be sure to check back often as we continue to release new articles in each chart type in this sub-series.

Introduction

  1. Text Table (Crosstab)
  2. Heat Map
  3. Highlight Table
  4. Symbol Map
  5. Filled Map
  6. Pie Chart
  7. Horizontal Bar Chart
  8. Stacked Bar Chart
  9. Side-by-Side Bar Chart
  10. Treemap
  11. Circle View
  12. Side-by-Side Circle View
  13. Line Charts (Continuous & Discrete)
  14. Dual-Line Chart (Non-Synchronized)
  15. Area Charts (Continuous & Discrete)
  16. Scatter Plot
  17. Histogram
  18. Box-and-Whisker Plot
  19. Gantt Chart
  20. Bullet Graph
  21. Packed Bubbles

More Tableau Essentials

Want to learn more about Tableau? We have several posts outlining all of Tableau’s fantastic features. Check out the full list on our Tableau Essentials blog channel.

As always, let us know if you have any questions or comments about this post or Tableau in general. If you’re looking for personalized training or help with something bigger, contact us directly!

Contact Us

Want More Tableau Essentials

  1. Tableau Essentials: Chart Types – Introduction
  2. Tableau Essentials: Chart Types – The Text Table
  3. Tableau Essentials: Chart Types – Heat Map
  4. Tableau Essentials: Chart Types – Highlight Table
  5. Tableau Essentials: Chart Types – Symbol Map
  6. Tableau Essentials: Chart Types – Filled Map
  7. Tableau Essentials: Chart Types – Pie Chart
  8. Tableau Essentials: Chart Types – Horizontal Bar Chart
  9. Tableau Essentials: Chart Types – Stacked Bar Chart
  10. Tableau Essentials: Chart Types – Side-by-Side Bar Chart
  11. Tableau Essentials: Chart Types – Treemap
  12. Tableau Essentials: Chart Types – Circle View
  13. Tableau Essentials: Chart Types – Side-by-Side Circle View
  14. Tableau Essentials: Chart Types – Line Charts (Continuous & Discrete)
  15. Tableau Essentials: Chart Types – Dual-Line Chart (Non-Synchronized)
  16. Tableau Essentials: Chart Types – Area Charts (Continuous & Discrete)
  17. Tableau Essentials: Chart Types – Scatter Plot
  18. Tableau Essentials: Chart Types – Histogram
  19. Tableau Essentials: Chart Types – Box-and-Whisker Plot
  20. Tableau Essentials: Chart Types – Gantt Chart
  21. Tableau Essentials: Chart Types – Bullet Graph
  22. Tableau Essentials: Chart Types – Packed Bubbles
  23. Tableau Essentials: Formatting Tips – Introduction
  24. Tableau Essentials: Formatting Tips – Custom Shapes
  25. Tableau Essentials: Formatting Tips – Labels
  26. Tableau Essentials: Formatting Tips – Color
  27. Tableau Essentials: Formatting Tips – Tooltips
  28. Tableau Essentials: Formatting Tips – Maps
  29. Tableau Essentials: Calculated Fields – Introduction
  30. Tableau Essentials: Calculated Fields – Logical Functions
  31. Tableau Essentials: Calculated Fields – Number Functions
  32. Tableau Essentials: Calculated Fields – Date Functions
  33. Tableau Essentials: Calculated Fields – String Functions
  34. Tableau Essentials: Calculated Fields – Type Conversion
  35. Tableau Essentials: Calculated Fields – Aggregate Functions
  36. Tableau Essentials: Calculated Fields – User Functions

More About the Author

Robert Curtis

Managing Director, APAC
Kickstarting Data Innovation in Healthcare On 13 March 2024, InterWorks was a proud Platinum sponsor of the first ever Data & Analytics in Healthcare conference, hosted by ...
Building Solutions with InterWorks at Corinium’s Data Architecture Conference in Melbourne InterWorks was a proud sponsor of the Data Architecture Conference hosted by Corinium in Melbourne on 21 and 22 June 2023. Hundreds of ...

See more from this author →

InterWorks uses cookies to allow us to better understand how the site is used. By continuing to use this site, you consent to this policy. Review Policy OK

×

Interworks GmbH
Ratinger Straße 9
40213 Düsseldorf
Germany
Geschäftsführer: Mel Stephenson

Kontaktaufnahme: markus@interworks.eu
Telefon: +49 (0)211 5408 5301

Amtsgericht Düsseldorf HRB 79752
UstldNr: DE 313 353 072

×

Love our blog? You should see our emails. Sign up for our newsletter!