Have you ever been in a situation with Tableau where you have developed a couple of great views, you put them in a dashboard, and they won’t fit to width unless you squash everything up? And then you cannot make sense of things anymore and you end up with multiple scrollbars?
Do you flip the labels to vertical to make it fit? Do you make your dashboard 5000px wide? Do you shoehorn everything into a single sheet in some sort of hacky way? Wouldn’t it be great if we could do synchronized scrolling across multiple views in the same dashboard?
Fret not, you can do synchronized scrolling, and it looks best if it’s horizontal!
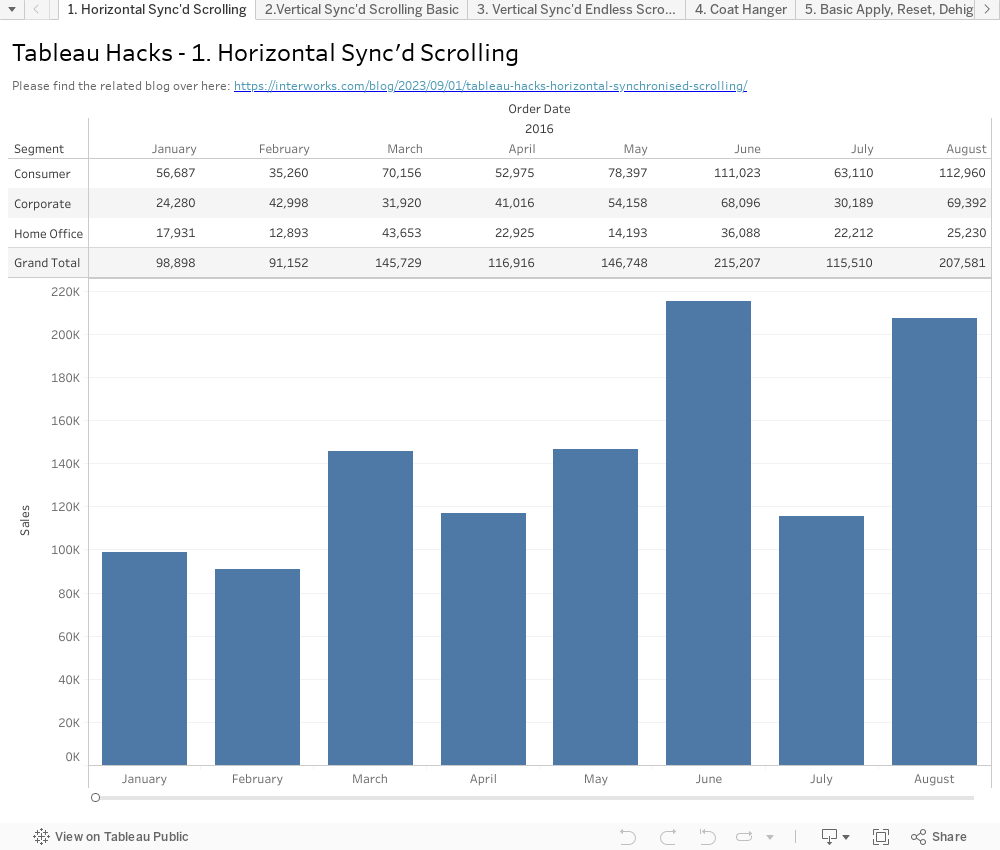
So, here is our baseline situation. A detailed crosstab at the top, a bar chart at the bottom, and two scrollbars ☹.
We start by creating two parameters. The first one is called [Position] and is a float parameter with a minimum value of 0 and a maximum value of 1. The second one is an integer called [Size], which defines how many months we’d like to fit on the screen. We set this to 8 months to start off with, but keeping it as a parameter enables us to experiment with the number of months we think fits best in the dashboard.
Next up, we create a [Position Filter] calculation like this:
(INDEX() > [Position] * (WINDOW_MAX(INDEX ()) – [Size])) and (INDEX() <= ([Position] * (WINDOW_MAX(INDEX ()) – [Size]))+ [Size])
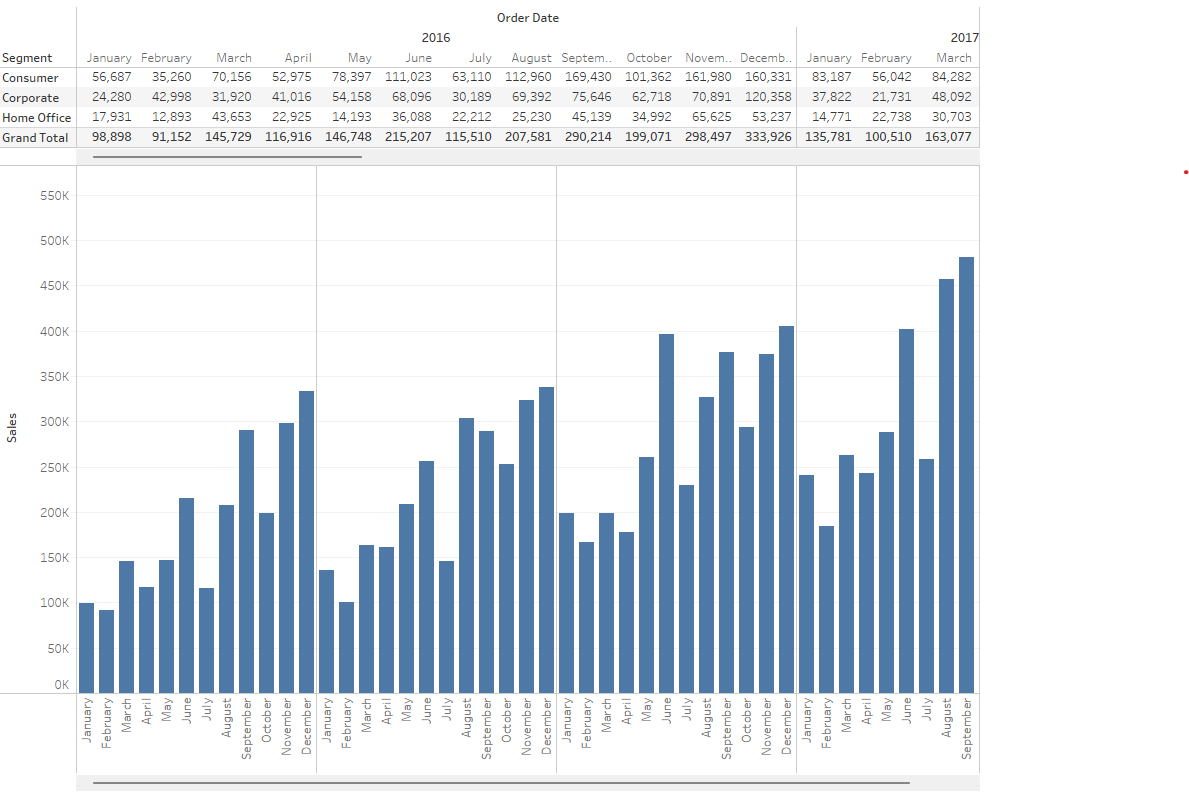
Let’s take this apart. The INDEX() will give every month/year a number starting from one. We have 48 month/year combination, so the maximum INDEX() is going to be 48, which is calculated using the WINDOW_MAX(INDEX ()) bit. Let’s assume the [Position] is set to 0.
The first bit of the calculation will therefore say, “The index needs to be bigger than 0*(48-8)=0 and smaller than or equal to (0*(48-8))+8=8”, so it will show the first 8 months.
If we move the position to 0.2 the calculation will say “The index needs to be bigger than 0.2*(48-8)=8 and smaller than or equal to (0.2*(48-8))+8=16”; from September 2016 (INDEX() = 9) to April 2017 (INDEX() = 16).
Now, we add this calculation to both views, setting the Compute Using to Table Across (or the specific dimensions [Month of Date] and [Year of Date]). On our dashboard, we can set both views to fit width, but you might need to fiddle a bit with the axis ruler/ column divider to line them up nicely. We put them both in a Vertical Container without any padding on the views themselves.
Finally we add the [Position] parameter as a slider to the bottom of this container and add padding left and right to line it up nicely with the actual months. We can now use this slider to scroll left and right and keep both views in sync.
You can find the workbook published here on Tableau Public and embedded below: