
In Tableau, it is pretty straightforward to build multiple smaller graphs in one view. Want to split this bar chart by country? Add your [Country] dimension to the Row shelf. Want small line charts by [Category] going across? Add the [Category] to the Row shelf.
But what if you want to make a grid of small graphs? That will make it a bit more tricky, but worry not — there is a hack for that.
What we are going to build is a nice small multiple grid to show SUM([Sales]) over time by [Country]. We’re going to show this on a line graph with continuous months on the axis. To start, we give every [Country] a rank based on their total SUM([Sales]).
We can use a RANK_UNIQUE calculation over a FIXED calculation that calculates the total SUM([Sales]) for every [Country] or a RANK_UNIQUE over a WINDOW_SUM doing the same. The problem is that some countries will not have sales data for any particular month. Even when we calculate the total sales for a country regardless of month, if there is no data for a month, this will result in a blank value if we use FIXED. As a result, if the month of order date is in view, the ranks might shift due to blanks EVEN if the rank is consistent without month in view at all (total SUM([Sales]) by [Country] regardless of dates stays the same).
To prevent this from happening, we NEED to use a WINDOW_SUM and we actually need to be pretty careful in the settings of that WINDOW_SUM. The WINDOW_SUM and RANK elements need to be calculated in a specific way in the first place, with the WINDOW_SUM calculated across months and the RANK across countries, so they need to be two separate calculations:
[WINDOW_SUM Sales] = WINDOW_SUM(SUM([Sales]))
[Rank WINDOW_SUM Sales] = RANK_UNIQUE([WINDOW_SUM Sales])
Next up, we need to create two calculations that will create a grid for us based on this rank. We first have to decide how many small graphs we want to go across. Just so we can play around with this and see what looks best, lets put this value in a parameter first:
[Small Multiples Number of Columns] = 3
We now need to create a Row number calculation first, grouping up every 3 Countries into one row:
[Small Multiples Row No] = INT(([Rank WINDOW_SUM Sales]-1)/[Small Multiples Number of Columns])+1
Next we create the Column number calculation, repeating the column numbers (1,2,3) for every row:
[Small Multiples Column No] = [Rank WINDOW_SUM Sales] – (([Small Multiples Row No]-1)*[Small Multiples Number of Columns])
It’s probably best to change both of them from Continuous to Discrete, as we need them for a grid using discrete values on the Column and Row shelves.
Now let’s put this all together. First, put the SUM([Sales]) on row shelf and a continuous month of [Order Date] on the column shelf. Make sure it’s a line chart and add [Country] to the detail shelf. You will now have many lines in one graph.
Next, add the [Small Multiples Column No] to the column shelf and the (you guessed it) [Small Multiples Row No] to the row shelf.
We need to update both table calculations. The WINDOW_SUM part of the calculations need to be calculated across every Month of [Order Date] for every [Country]. Compute Using Month of [Order Date] and Partition by [Country]. However, because we are basically asking Tableau to restart the calculation for every [Country], this will cause issues for missing months for certain countries as they are not considered in the WINDOW_SUM (creating a gap in the data). When the RANK bit happens, it will ignore the gaps in the data and shift up all the ranking below. We don’t want that, so we need to do two things to ensure that doesn’t happen.
First, enable Show Missing Value on the Month of [Order Date] on the Columns shelf. This ensures that there is at least a placeholder to consider for the table calculations. This does not apply, however, if the date field on the column shelf is discrete or you use a completely different discrete field here instead of a date field:
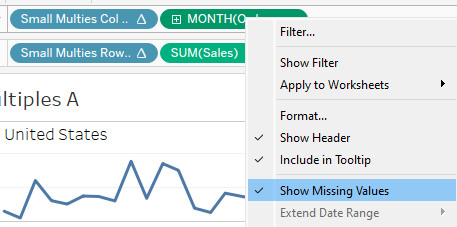
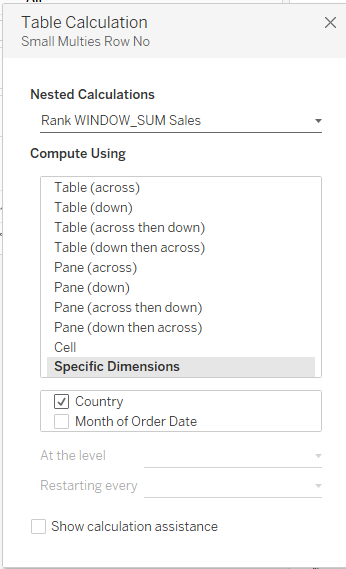
Now, the RANK bit of the table calculation needs to be calculated across every [Country] (the rank of one is inferred by the value of every other [Country]). The WINDOW_SUM element will still need to be calculated across Month of [Order Date], but we now include the [Country] as well and switch the “at the level” setting to Month of [Order Date]. This will force Tableau to consider the month of [Order Date] in isolation of the [Country] and not within the context of [Country] and with the Missing Values now being “visible,” the WINDOW_SUM of [Sales] will be applied to months even if there is no data for that month for a particular [Country]. It is, however, important to keep the Month of [Order Date] as the first field in the list of specific dimensions:

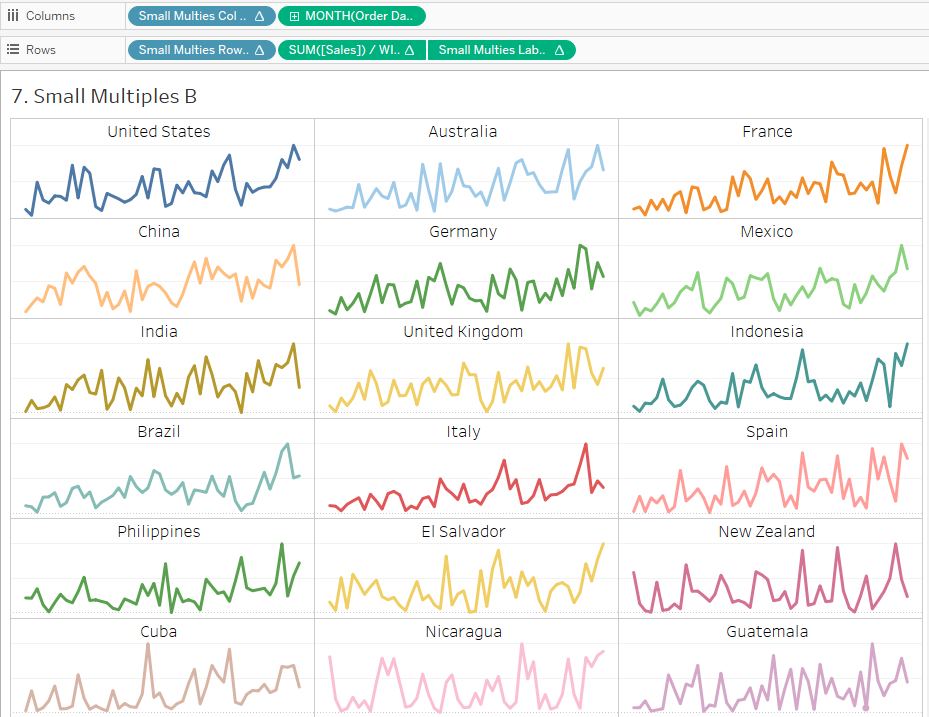
Your view should now look like something like this, which is already pretty cool:

However, we still need to label these small multiples of course and this is actually quite tricky again.
We cannot use our normal column or row shelves for our dimensional labels, since, well, the labels needs to be applied to every individual line graph here. Putting [Country] on row will split the three horizontal graphs into separate rows again, putting [Country] on column will result in splitting the columns into many separate columns.
We cannot use a reference line, as you can only label a reference line with its value, the underlying field (which would either be the Month of Order Date or SUM([Sales])) or a constant.
If we put a placeholder value (such as a MIN(1) ) on the column shelf, it would have an row-value of the SUM([Sales]) in total for that country, as you cannot simply ignore the values on the other shelf.
We CAN add a placeholder value on the row shelf instead. If this is a MIN(1), it will add a mark for every month, or at least every month we have data for for any given [Country], and we can add a label at the end of start of the line, but not the middle. To ensure the position of the label is always all the way to the left (or right), use IFNULL(MIN(1), 1) instead to fill up non-existent values at the start or end of the line for some countries:

The other option would be to add a placeholder value on the row shelf for the “centre position.” Again, you need to take into account that the centre position could be non-existent for some countries. This calculation will add a placeholder “1” on the row shelf. But only once at (roughly) the centre position for the x-axis:
[Small Multiples Label Position] = IIF(Index()=INT(WINDOW_MAX(index())/2), IFNULL(MIN(1), 1),null)
When added to the row shelf and calculated for every [Country] across every Month of [Order Date], this will add a mark for the index value that equals half of the maximum index value by [Country] pane (or if uneven, rounded down using INT).
We can now use this single mark per [Country] to attach the [Country] label to. Finally, before I hide the [Sales] axis, I change the SUM([Sales]) to SUM([Sales])/ WINDOW_MAX(SUM([Sales])), and compute using Month of [Order Date]. This is to ensure that all the little line graphs are using the full height of their respective panes. The actual SUM([Sales]) is left on the tooltip.
Finally, just to ensure that the labels don’t cross the actual line, I add a constant reference line on the Row axis, which is not relative, and set it to 1.3:
Check out the full dashboard for this blog post here.