
If the axis on your viz can change from anywhere between single numbers to millions depending on your filters, it might sometimes be a bit annoying that the number formatting on the axis and labels doesn’t change.
However, as always, there are ways around this. Let’s have a look at making the labels and axis a bit more dynamic, and change their formatting from full numbers to thousands and millions.
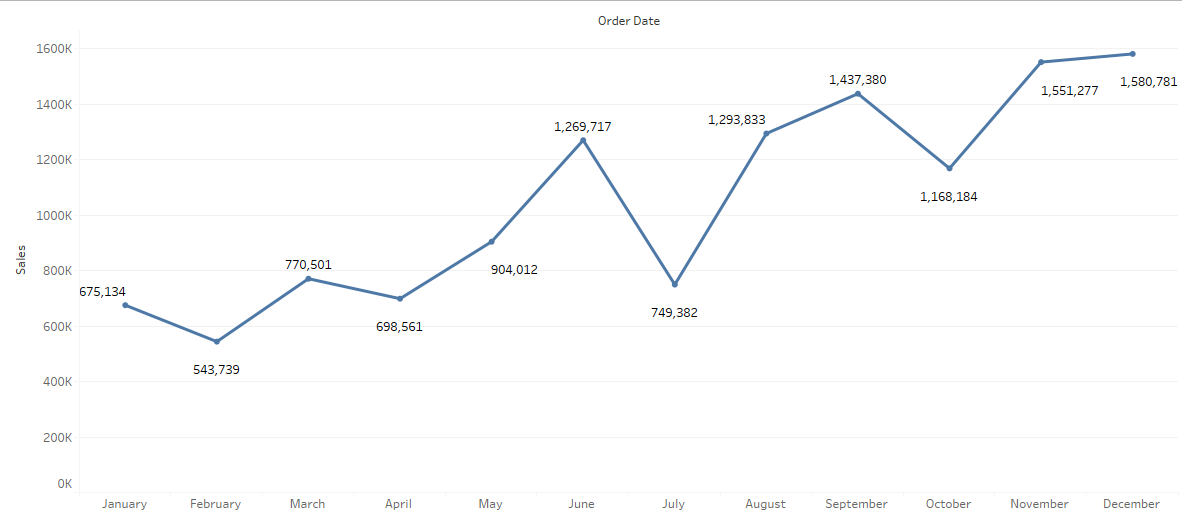
In this view, the SUM([Sales]) is on the row shelf as well as the labels. I’ve included filters for [Category], [Sub-Category] and [Country], so the values on the axis and labels tend to vary wildly depending on the filter options. For both the labels and axis, I left the formatting set to automatic, but, as you can see, Tableau already decides to use different formatting on the labels and the axis anyway:
We will first have a look at making the axis value formatting a bit more dynamic:
[Sales Axis] = IIF(WINDOW_MAX(SUM([Sales]))<1000,SUM([Sales]), IIF(WINDOW_MAX(SUM([Sales]))<1000000,SUM([Sales])/1000, SUM([Sales])/1000000))
This will ensure a consistent rounding of the values in the view based on the maximum mark value, in this case the SUM([Sales]) by Month of [Order Date]. If the maximum value in the view is less than 10,000, it will show the full unrounded value on the axis. If the maximum value is over 10,000 but under a million, it will show thousands. If the maximum value is over a 100,000, it will show millions.
One little snag is that, whilst the number to the axis will change, it doesn’t actually change the suffix to K or M. We need a little trick that will tell the user how the number is expressed. So we need an additional label. It will not look exactly like the screenshot above, but it will be dynamic:
[Sales Axis Label] = IIF(WINDOW_MAX(SUM([Sales]))<10000,’$’, IIF(WINDOW_MAX(SUM([Sales]))<1000000,’$K’,’$M’))
This calculation needs to be added to the Rows shelf, and we need to remove the actual axis label, which this calculation replaces. We can also rotate the label to look more in line with actual axis labels on the Rows axis:
With Tableau 2023.1, we could also add dynamic axis labels. To make this work, you either need a constant field or parameter to control the label. Since the label depends on the value in view, the only way to control this using a field is a (strict) fixed LOD, which in turn means that all of our filters need to be in context. Since the view is already quite dependent on table calculations, we will stick to the current field on row label workaround, but we could create a calculation like this to actual add directly to the Axis Title via Edit Axis:
{MAX(IIF(
{MAX({FIXED DATEPART(‘month’, [Order Date]):SUM([Sales])})}<1000,’$’,
IIF(
{MAX({FIXED DATEPART(‘month’, [Order Date]):SUM([Sales])})}<1000,’$K’,’$M’)))}
Now we need to work on the labels. This is actually a bit easier, in a sense, as we can split this out into three separate labels for whole numbers, thousands and millions. First we need to create three separate calculations:
[Sales <10k] = IIF(SUM([Sales])<10000,SUM([Sales]),null)
[Sales < 1m] = IIF(SUM([Sales])>=10000 and SUM([Sales])<1000000, SUM([Sales]),null)
[Sales >= 1m] = IIF(SUM([Sales])>=1000000, SUM([Sales]),null)
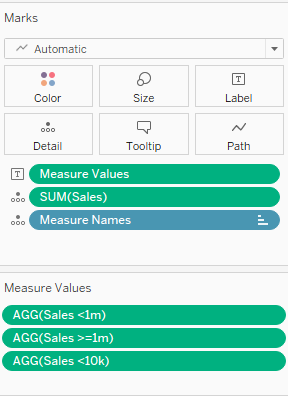
Since for any given mark, only one of the three fields will have a value and the other two will be NULL, you can put [Measure Values] on text and only have these three new fields on the [Measure Values] shelf and, even though the fields will overlap, only one has an actual value:
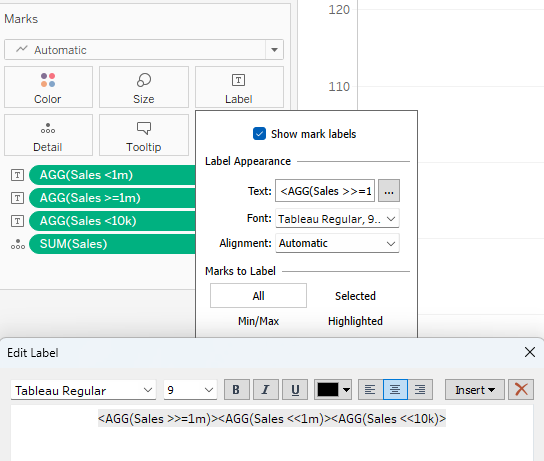
You can also put the three fields on the marks’ label NEXT to each other. Just make sure they are NEXT to each other and not on different lines, so the null values will not result in empty lines:
You do need to update the formatting, as all these calculations will do is hide values outside of the range you specified. Let’s update the first one, [Sales <10k], by right clicking the field on the Marks card and selecting format. Select “Currency (Custom),” two or no decimals, and display unit = None.
For the [Sales <1m] we select “Currency (Custom)” and display unit = Thousands (k). Decimals can be anything you like. And for [Sales >= 1m] we select “Currency (Custom)” and display unit = Millions (m).
Add whatever filters you like, such as [Category], [Sub-Category] and [Country]:
Check out the full dashboard for this blog post here.