Following up from the previous post, vertical synchronised scrolling can be even more of an issue. We’ve come up with two options here depending on the use case (and preference). The first option is pagination.
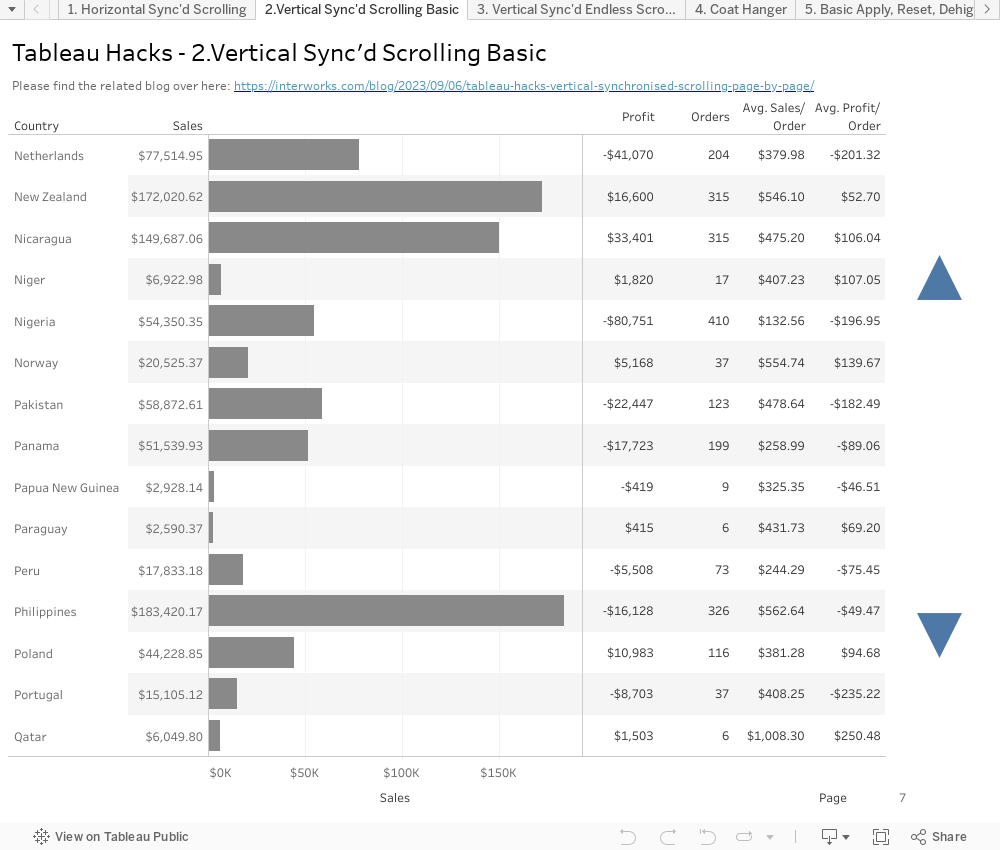
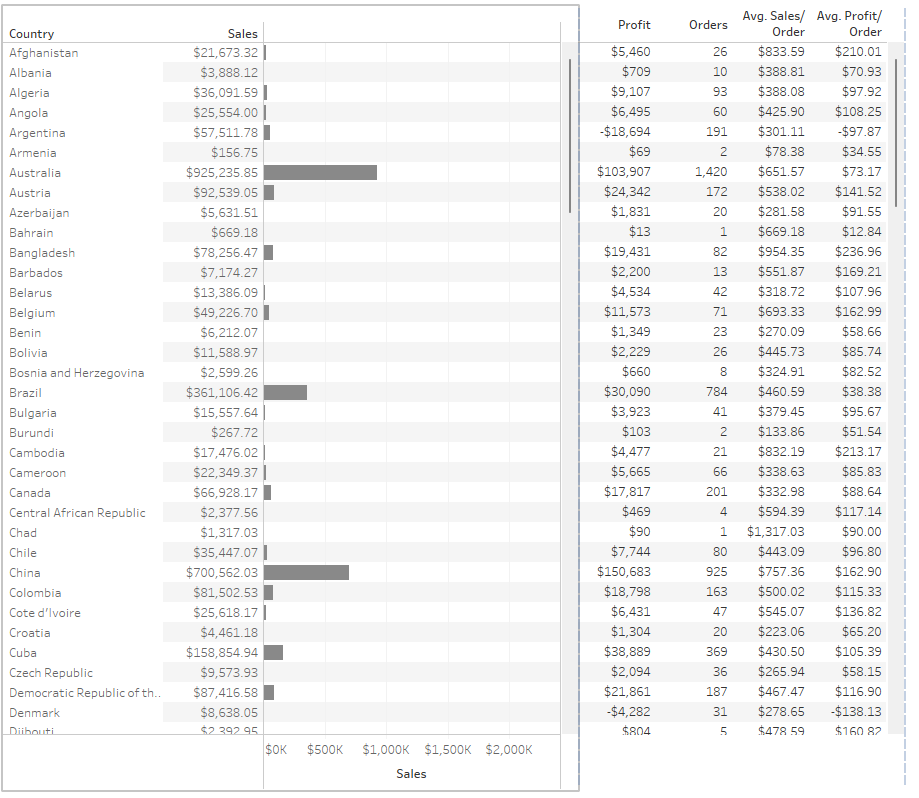
Our business is selling stuff all around the globe and we would like to give a quick overview of SUM([Sales]) by country in a vertical bar chart, as well as SUM([Profit]) and COUNTD([Order ID]), as well as average Sales and Profit per order. We could use a forklift, which I will explain in a bit more detail in one of the next blogs in this series, but we don’t want the individual “text” columns to take as much space as the single column SUM([Sales]) bar chart. So, we will put two views next to each other instead.
Here we end up with two scroll bars again, so how do we solve the problem this time? We can use with buttons that scroll the page up and down, one page at a time.
We start by creating two parameters. The first one is called [Page] and is an integer parameter which allows all values. The second one is called [Page Size], which is also an integer and defines how many countries we’d like to fit on the screen. Let’s set this to 15.
Next up, we create a calculation called [Max Page]. This calculation is to define the final page based on the total number of countries in the dataset: INT(({(COUNTD([Country])}/ [Page Size])+.99)
There are 147 countries in the dataset, so the calculation would result in (147/15)+.99 = 10.79, rounded down by the INT function that makes 10. Now, you might wonder, what is the +.99 doing in that calculation. We want to ensure that the number rounds up to the next full integer after dividing the countries by the page size. We could use CEILING instead of INT, but for compatibility we prefer INT, as CEILING doesn’t work well with some data sources. INT just cuts of the decimals so is in fact more akin to FLOOR, so we add (almost) 1 to ensure that we have an additional page for the final 12 countries. But why not just one? Well, if the number of countries is already a perfect multiple of the page size, adding one to it will round it to the next integer. For example, let’s assume 150 countries; 150 divided by 15 would result in 11 and not 10.99 becoming 10.
The next calculation is the [Page No] itself, i.e. calculating what Page a country row belongs to. We could use a similar +.99 calculation, but instead we will use the following calculation: INT((INDEX()+([Page Size]-1))/[Page Size]). For the 32th country in the list, this would make the Page (32+(15-1)) = 3.06, so Page 3. FYI, the INDEX() needs to be computed using the dimensions that define what a single row is, in our case [Country]. This ensures that all countries get a unique ID that depends on the sort order in our view, which is this case is alphanumerical
We use [Page No] in a Boolean filter like [Page No] = [Page] and put this on the filter shelf of both views. We now need to make the buttons “turn the page,” which will need two calculations: one for up or previous and one for down or next. These will be the calculations to change the page number. This version also ensures that if we are on page one and go up, the page will go all the way to the max page and vice versa. Obviously, if you don’t want this behaviour, it’s not needed and you can just make it stop going all the way around when at the first or last page.
[Previous Page] = IIF([Page] = 1,[Max Page],[Page]-1)
[Next Page] = IIF([Page] = [Max Page],1,[Page]+1)
The buttons themselves can be anything, but for simplicity we will add two triangle shapes to the side of both views on the dashboard. The one pointing up should have the [Previous Page] calculation on Detail, and the one pointing down [Next Page]. To finalise this, we just need to add two parameter actions to make “turning the page” work by applying the Previous/Next Page calculations to the [Page] parameter on select.
Just a quick final note: When clicking these buttons, they will act like any other mark in Tableau and will be highlighted. In an upcoming blog post within this series, I will go through the motions of de-highlighting marks which is especially useful when creating buttons for actions on your dashboards.
You can find the workbook published over on Tableau Public and embedded below: