
In my previous blog, we discussed Multi-value parameters via the use of parameter actions and concatenation of values. Here, we used a view on the dashboard to act as a driver for the parameter to be filled with one or more values.
You can also have multiple views act as drivers for parameters, and have one depend on the other to create “dynamic” parameters.
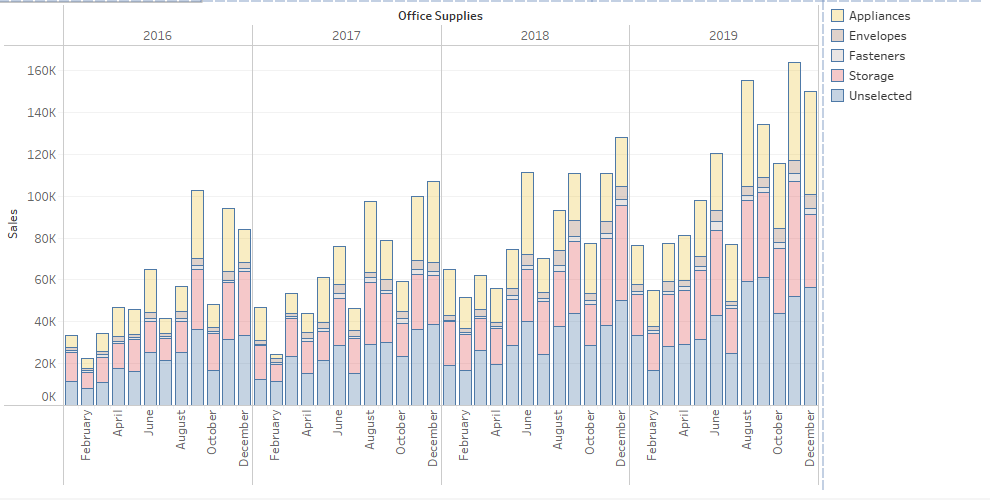
What we want to achieve today is a bar chart that shows the total SUM([Sales]) for a [Category], and month and year of [Order Date], with the bars being slightly transparent. We also want to be able to colour different segments of the bar by a selection of [Sub-Category]. Everything else drops into an “Unselected” group. Something like this:
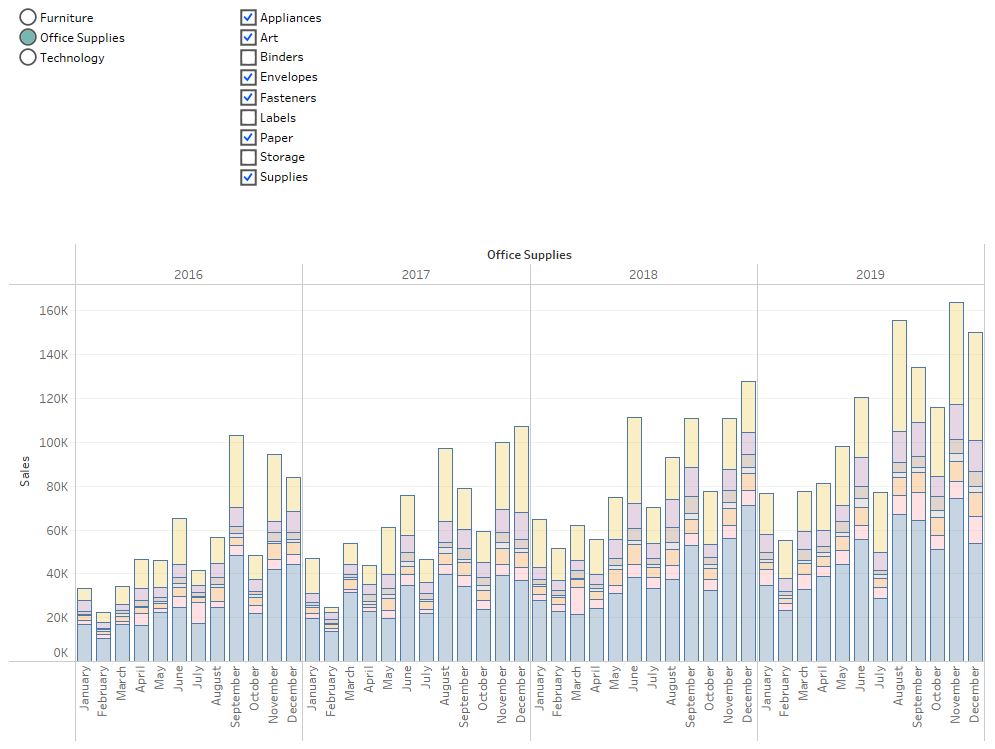
This could be done using filters, sets and LODs, but we are going to use parameters instead. We need to “fake filter views” to do this. Our end-goal for the dashboard is something like this:
Let’s start with a “selection view” for the initial Category selections. We want this to be single select only.
On an empty sheet, we put [Category] on the Rows shelf and two placeholders on the Columns shelf. Both placeholders can be a Calculated field with MIN(1) or we can just type “MIN(1)” straight on the Columns shelf instead. We change the first MIN(1) on the shelf to a shape – open circle, and the second MIN(1) will need to be a closed circle, size slightly smaller than the first shape circle.
Next up, we add the [Category] to the label of one of the two MIN(1) marks, extend the axis to 0 — 10 and synchronize them. We create a [Category Parameter], a defined list with all values in [Category], and a filter and highlighter based on this parameter like this [Category Highlight] : [Category Parameter] = [Category]. Drop this filter/highlighter on the colour shelf of the second MIN(1), the circle mark and set the colour to anything you like for true and white for false.
Finally, we add the well known by now (I hope – see blog number 5 in this series for more information) [zzTrue] and [zzFalse] fields to both marks to enable de-highlighting on our dashboards, and empty field (a calculated field or ad-hoc calculation containing two quotes or an empty string), and we hide both axis and [Category] column on the Rows shelf:
Now we duplicate this sheet for the [Sub-Category], replace [Category] with [Sub-Category] everywhere in this view and add the [Category Highlight] to the filter shelf (set to True).
There are a couple of additional things to do here. First, let’s create a [Sub-Category Parameter] which should be a free text field, a field called “[Sub-Category Highlight]” which uses this formula: “CONTAINS([Sub-Category Parameter], [Sub-Category])” and, finally, a field used to populate the [Sub-Category Parameter] via a parameter action on the dashboard. This one is a bit tricky, but similar to how we did the multiselect on the previous blog:
[Dynamic Sub-Category for Parameter] = IF CONTAINS([Sub-Category Parameter],[Sub-Category]) THEN REPLACE([Sub-Category Parameter], [Sub-Category]+’,’,”) else [Sub-Category Parameter]+[Sub-Category]+’,’ end
Quick translation here: if our free text [Sub-Category Parameter] parameter contains the [Sub-Category] we just clicked, we remove it from this parameter including a trailing comma. If it does not yet appear in the parameter, add it with a trailing comma. This enables us to select and de-select Sub-Categories and they will be added or remove from the free text parameter, including commas to separate them.
Finally, we change the marks. The first MIN(1) we change to black open square shapes for all, the second MIN(1) we change to tick marks for when the [Sub-Category Highlight] is true and any shape for the false option, as long as it’s coloured white.
So now we have two small views that will act as filters when the right parameter actions are applied on the dashboard – the first one is a single select [Category] filter that will populate a string parameter based on a set list of possible values — the Categories. The second one is a multiselect [Sub-Category] filter that will populate a free text string parameter with Sub-Categories concatenated as value:
So, now we need an actual chart that is affected by both parameters in turn. Quick recap: we want a bar chart with the Sales Value split by Month and Year. This bar chart needs to be filtered on a single Category (via our first parameter), and the bars need to be segments with whatever Sub-Categories we have selected in our second filter view via the concatenated string parameter. Every Sub-Category not selected will be grouped into an “Unselected” Sub-Category.
Let’s start a new sheet, add the [Category Highlight] to the filter shelf first so it filters to the [Category] in [Category Parameter] aka the [Category] selected in our first filter view. Add the YEAR([Order Date]) and MONTH([Order Date]) to the columns shelf and SUM([Sales]) to the Rows shelf. By now you should have a simple bar chart showing the Sales by Month and Year for the selected [Category].
We need to make an additional field that will dynamically show Sub-Categories that are in our multiselect filter view/concatenated string parameter, and will bundle up all the other non-selected Sub-Categories within the selected Category are grouped up into “Unselected.” Let’s call this calculation [Dynamic Sub-Category]:
[Dynamic Sub-Category] = IF CONTAINS([Sub-Category Parameter],[Sub-Category]) then [Sub-Category] else ‘Unselected’ end
Add this field to the colour shelf of your bar chart and adjust colours, opacity and perhaps add some lines in between the segments on the bar. Now, we need to add the interactivity itself – these parameters won’t update themselves, so let’s add the actions. We need three parameters actions and two de-highlight filter actions.
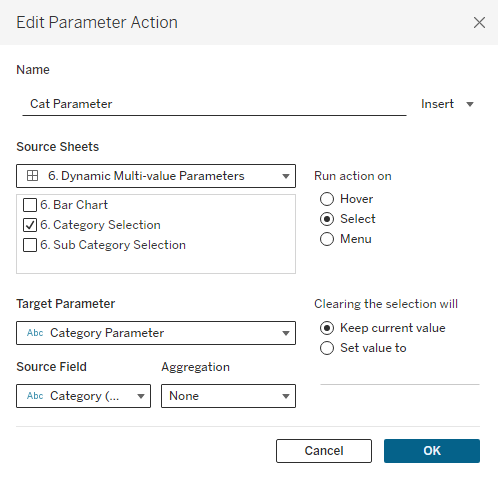
First let’s add the Category parameter action. This action will add a SINGLE [Category] to the [Category Parameter]:
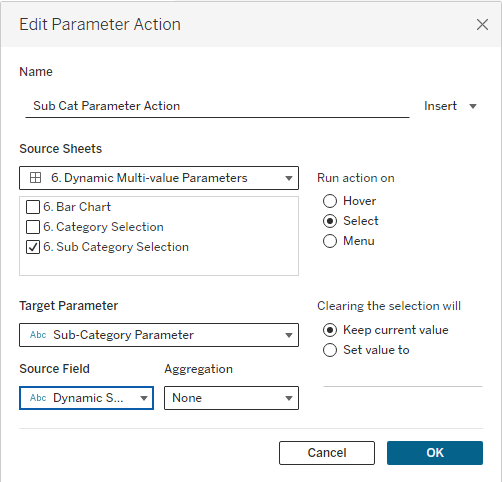
The next parameter action is to add multiple [Sub-Category] to the [Sub-Category Parameter]. Therefore it is using the [Dynamic Sub-Category for Parameter] field to check if a [Sub-Category] is already in there parameter or not when selecting:
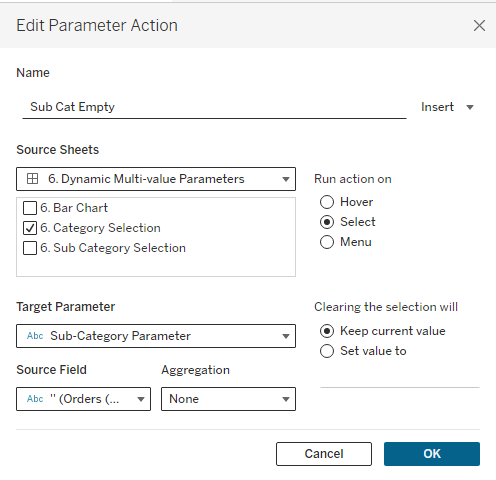
The third action is to empty the [Sub-Category] parameter when a different [Category] is selected. This will simply apply an empty string to the [Sub-Category Parameter]:
 Finally, we apply two delighting actions to the [Category] and [Sub-Category] filter views which we have already seen a number of times:
 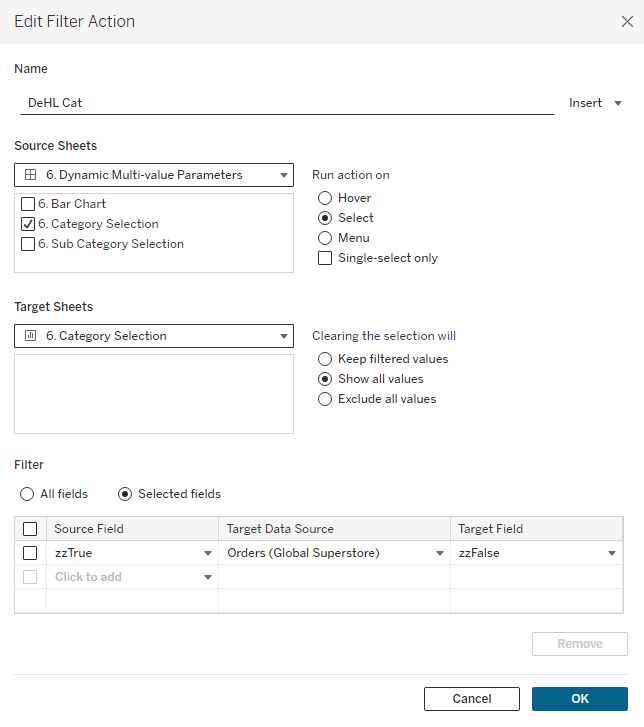 (For a further explanation see this blog.)
Now we have put everything together, here is the end result:
Check out the full dashboard for this blog post here.