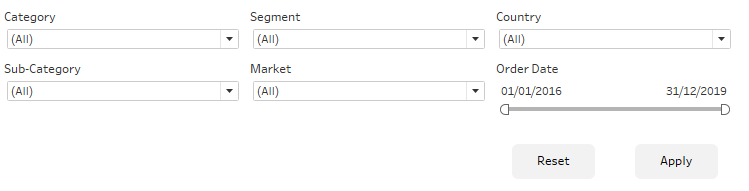
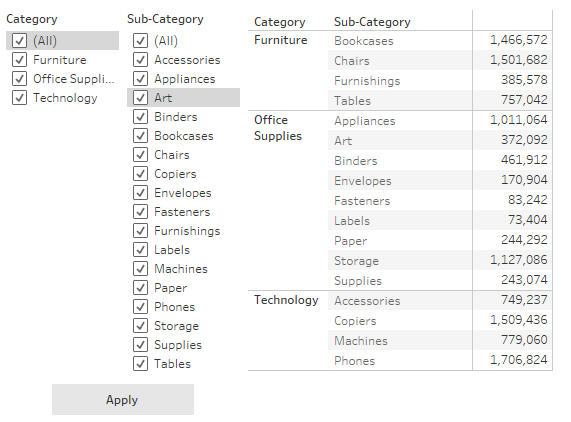
If you build any dashboard with more than a handful of filters, and your dataset is fairly large, changing and applying multiple filters can be painfully slow since you are waiting after every filter change for the data to load. In these cases, you might wonder why Tableau doesn’t provide an easy way of applying multiple filters at once after you changed the ones you want changing. Something like this, perhaps:
Well, wonder no more, there is a way to achieve this and also, whilst we’re on the subject, to “Reset” all those filters in one go as well. I will explain the de-highlighting in a bit.
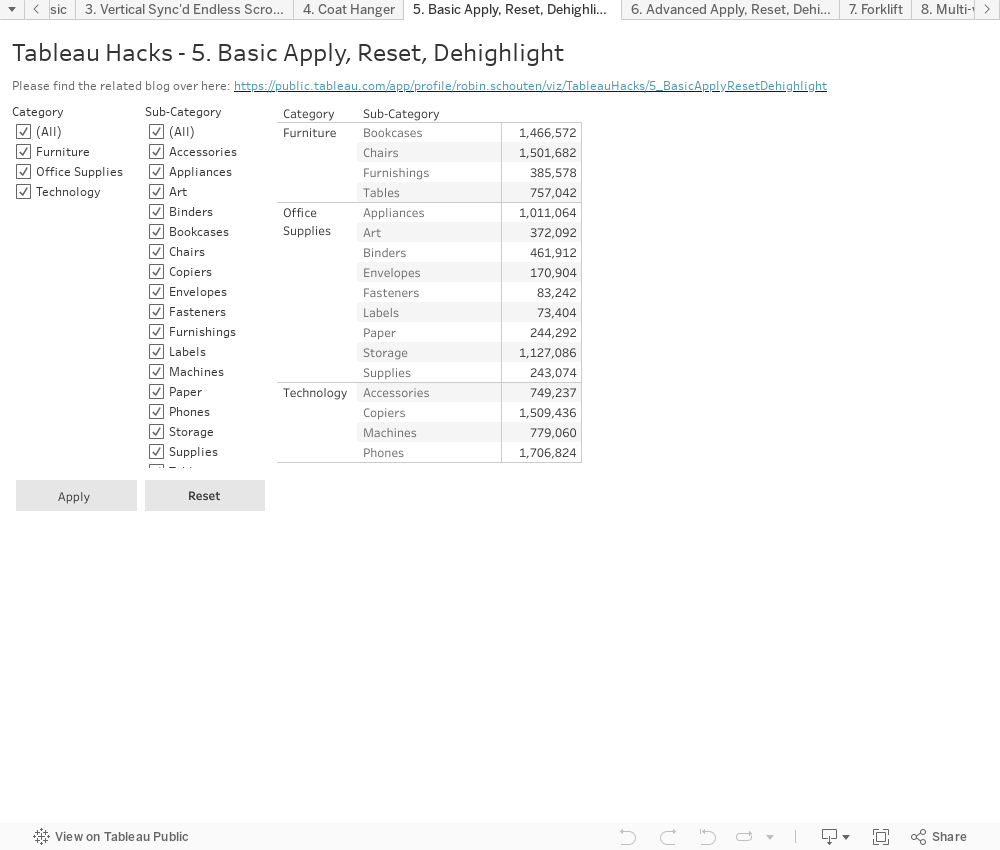
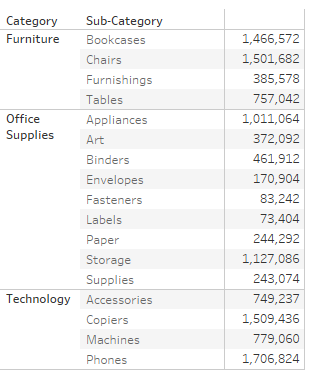
In this example, we will not use dozens of filters (just two, actually), but the idea stays the same. We first apply all our filters to an “Apply” button, which is actually just another sheet, and the Apply button “applies” those filters through actions in one go to our views on a dashboard. In our example, we just have a crosstab table with Category and Sub-Category on rows and the SUM([Sales]) value on our marks:
We want to add a filter for [Category] and Sub-Category, being able to select from both filters and then apply them both in one go. So, apart from this table, we need to build our Apply button sheet.
This Apply button sheet needs the fields we want to use to filter our crosstab on their own filter shelf first. So, let’s start with adding [Category] and [Sub-Category] to the filter shelf without filtering anything for now (leave them to all). We also need to ensure we can pass the selecting [Category] and [Sub-Category] to other views on the dashboard, so we do need to add them somewhere else. Let’s just add them to the Detail shelf. Normally, the problem is that when you have multiple values across these filters selected, multiple marks appear in the view. So if we change our mark to shape, square or just text and you select more than one [Category] and [Sub-Category] using the filters, the shape, square or text will be repeated as many times as we have marks in our view.
The easy solution here would simply be selecting a Polygon mark type, since there is nothing on our mark shelves to create a polygon. In a follow-up blog, we will explore other options, but for now we need to stick to a Polygon mark type. Nothing will be shown in the view, so now we need to add an “Apply” label (or any other label you want on this button). The easiest way to do this is double clicking on the empty Row shelf and adding “Apply” with quotes. There is now an ad hoc dimension called “Apply” which has a single value: Apply. The automatic field label to this new apply field will also be “Apply” but with quotes. We want to hide this label, and only keep the single Apply row value, so right click the “Apply” label (with quotes) and select, “Hide Field Labels for Rows” like this:
The next step is adding the button sheet to our dashboard. You can either put it in a container together with the filters that apply to the Apply button sheet itself or add the Apply button sheet floating on the dashboard instead. We are going to put a horizontal container next to our crosstab in our view, put the Apply button sheet in it and placing the [Category] and [Sub-Category] filters next to each other in a nested vertical container above the Apply button. Note that we want the filters to come from the Apply button sheet, so if you already have the filters on the dashboard, you will need to remove them and then re-add them from this Apply button sheet:
The next step is to ensure that the filter selection is applied to our main crosstab view when the Apply button is clicked. Go to the “Actions” menu via the Dashboard drop-down at the top of the screen or use CTRL-SHIFT-D. Add filter actions to the Apply button sheet that transfer the values of our relevant fields, in our case [Category] and [Sub-Category], to the relevant sheet on the dashboard — the crosstab for us in this instance:
Note here that we select “Keep Filtered Values” on “Clearing the Selection.” At the moment, the Apply button highlights when clicked. We will fix that in a bit, but for now, we want to make sure that deselecting the Apply button sheet doesn’t clear out our Crosstab or puts all values back in immediately.
When you make a filter selection and click “Apply,” the filter selection will now be applied to the crosstab. As you might have noticed, the Apply dimension that we “ad hoc” added to the view highlights just as any other dimension or mark normally does in Tableau. You need to click it again to de-highlight it and be able to use it again to apply different filter values. We will change that by adding a de-highlighting action to prevent the unhelpful automatic highlighting.
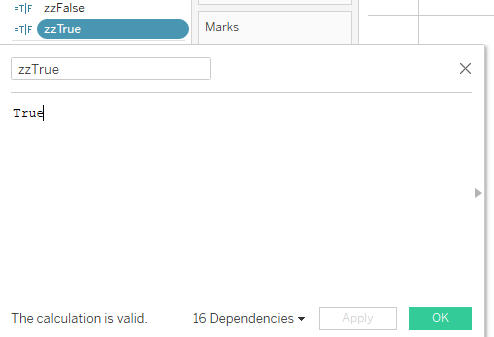
What we need to do to prevent highlighting is trick Tableau in thinking that the values that are highlighted do not exist anymore. There are multiple ways of doing this, but this one is my favourite: We create two new fields, one simply having TRUE as calculation and one FALSE. For simplicity and grouping them together, we will call them [zzTrue] and [zzFalse]:
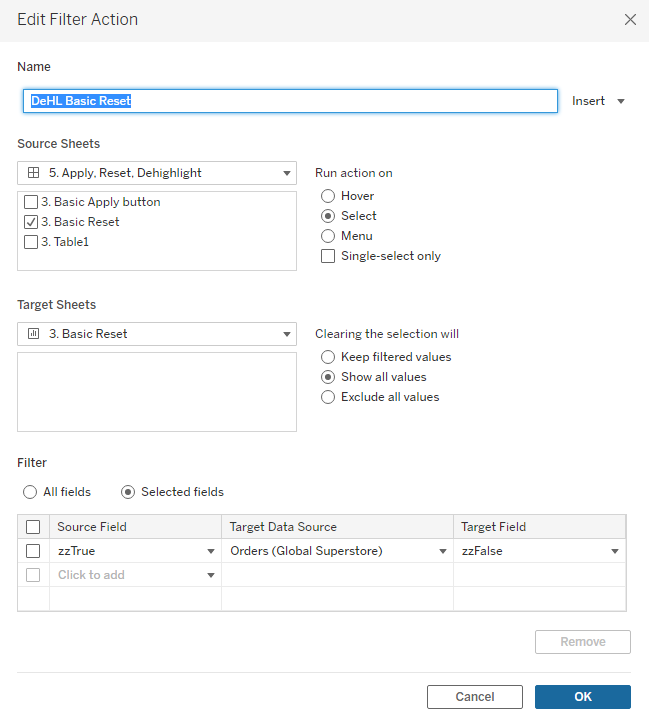
On the Apply button sheet, we need to drop both fields on the Detail shelf. We now go back to the dashboard and apply a new Filter action that applies the [zzTrue] to the [zzFalse] view. Since FALSE can never be TRUE, this action is enough to trick Tableau into not highlighting any mark or dimension on the view where this action is present. Couple of important pointers here:
- The Source sheet needs to be Apply button sheet on the dashboard.
- The Target sheet needs to be the Apply button sheet itself not the one on the dashboard (see screenshot for clarification.)
- The Source field needs to be [zzTrue] and the Target field needs to be [zzFalse].
- Clearing the selection will show all value. If we select another option, the apply button disappears after clicking since:
- If we apply True to False, everything will be False by default.
- If we exclude all value, everything is hidden by default.
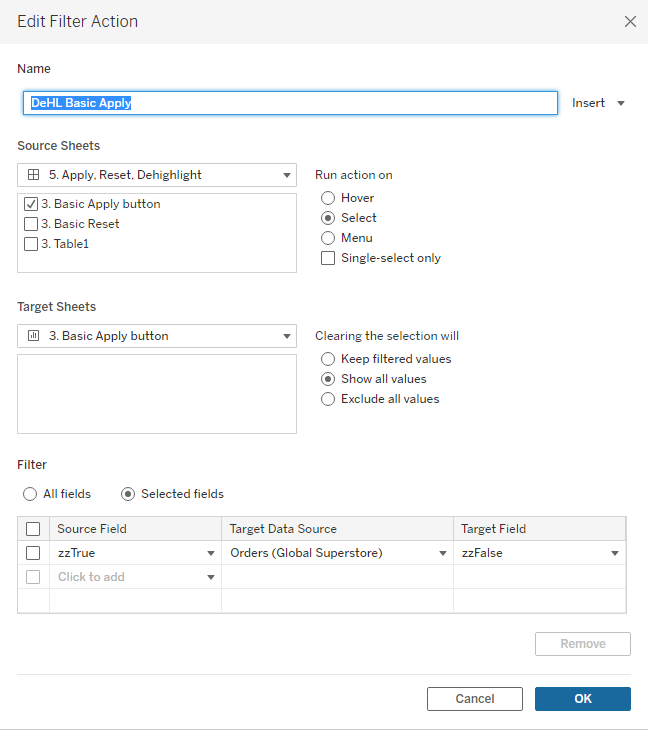
Above: The screenshot mentioned in the second bullet point.
Finally, to complete our dashboard, we need to add a “Reset” button. Similar to the “Apply” button sheet, we create a new sheet and add ad-hoc dimensions called “Reset” and “Hide Field Labels for Rows” to hide the quoted “Reset” field label. The difference is that we do not add the [Category] and [Sub-Category] to either the Filter or Detail shelf, but we do need to add our de-highlighter fields [zzTrue] and [zzFalse] to the Detail shelf so we can de-highlight action to the Reset button sheet as well. Since we haven’t put any multi-value dimension in this view ([zzTrue] and [zzFalse] only contain one value that applies to all rows in our data by default), we don’t need to make the mark type Polygon per se. There is only a single mark. Therefore, we leave it as an Automatic text mark. Now we add the Reset button view on our dashboard next to the Apply button view.
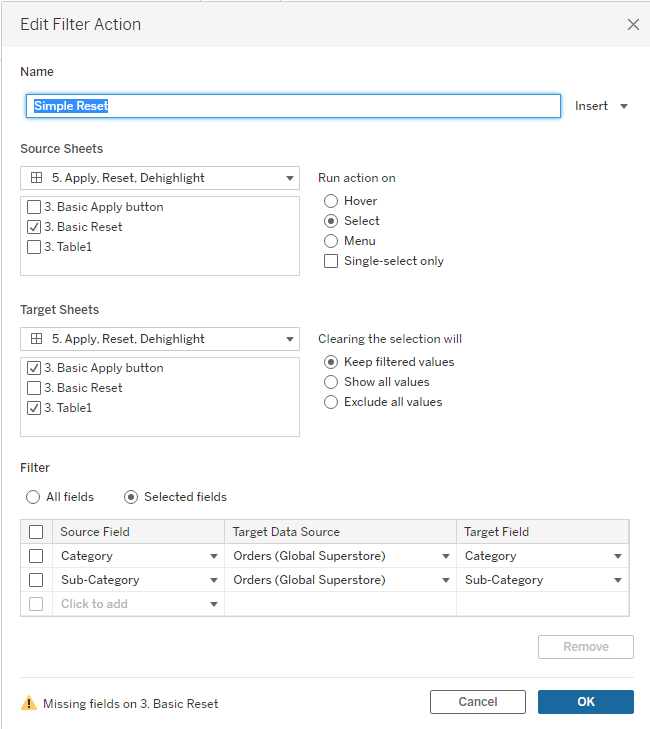
We now add a Filter action very similar to how the “Apply” button applies the [Category] and [Sub-Category] crosstab on our dashboard. The main difference is that the Reset action needs to be applied to the Apply button sheet as well as the crosstab to show all values in [Category] and [Sub-Category] in the crosstab and make sure that all these values are also ticked in the Apply button sheet filters. Also, because the [Category] and [Sub-Category] fields are not present on the Reset button sheet, Tableau will give a warning about missing fields. We can safely ignore this. This is the trick to make sure the filters actually go back to their initial “All” state:
While we are still in the Actions menu, we need to add the de-highlighting action to the Reset button sheet as well. This is exactly the same as the de-highlighting action we just added to our Apply button sheet:
Well, there you have it. Two filters with an Apply and a Reset button working flawlessly:
In the next blog, we will look into a slightly more advanced version of the Apply and Reset actions using a Shape instead of a Polygon mark type and resetting to blank and default values instead of all values. If you want to see these buttons in action, check out this dashboard: