In the previous Tableau Hacks blog, we discussed adding Apply and Reset buttons to our dashboard filters, as well as the trick to de-highlight these buttons for a better user experience. In today’s blog, we will look into some more advanced options, such as customising our buttons by using different mark types without multiplying the apply button, resetting to something else than “All,” and applying and resetting date ranges.
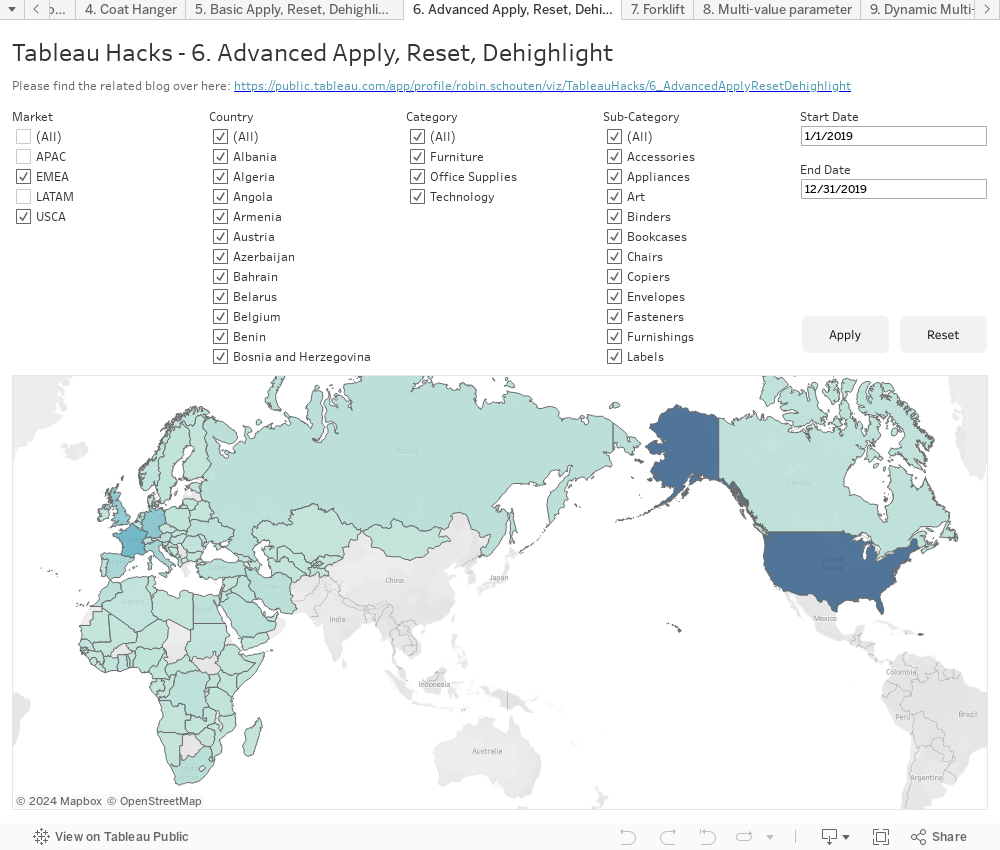
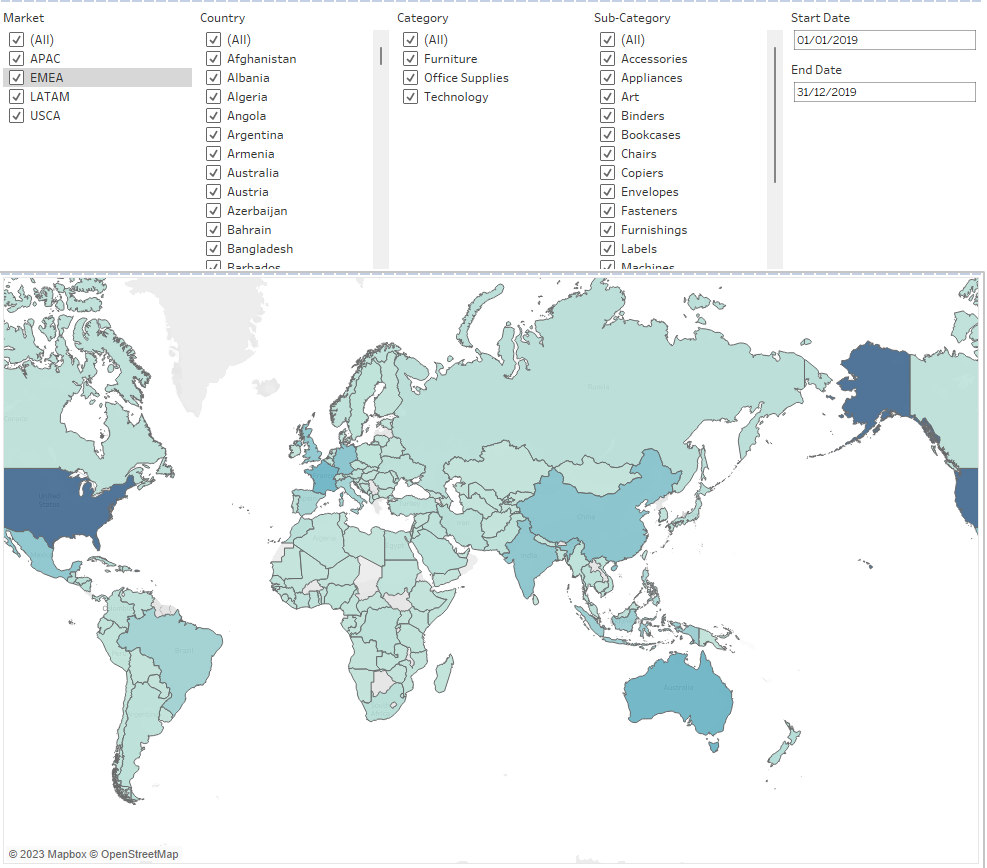
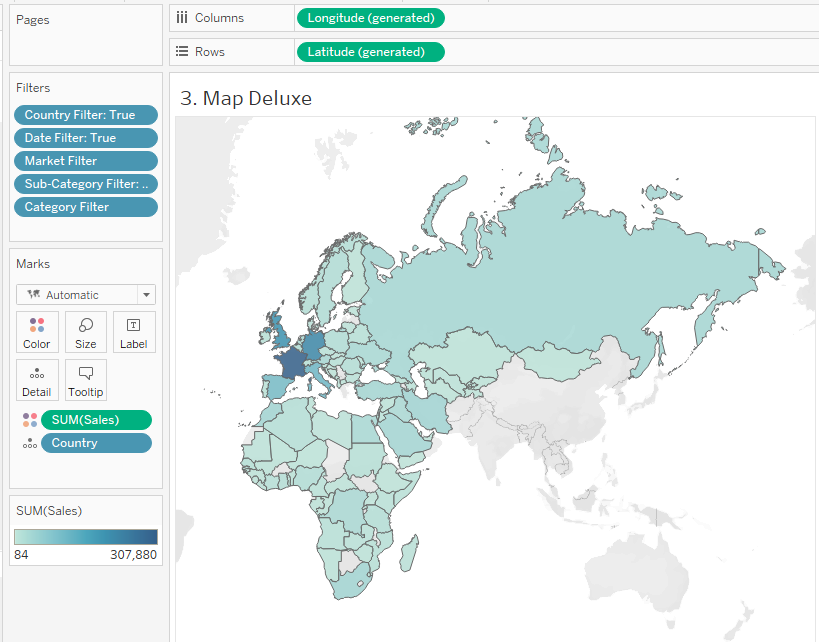
Our dashboard will contain a world map this time, filled in by country based on SUM([Sales]). We want to keep it flexible, the user can select Markets, Countries, Categories, and Sub-Categories, and dynamically change the start and end date for our SUM([Sales]) value by Country. Something like this, but with an Apply and Reset button with rounded corners:
Briefly referring back to the previous blog, an Apply button is just another sheet built to look like one. The issue is, we need to limit that sheet to a single mark if we want to use anything other than a Polygon mark type, otherwise we will have as many Apply buttons as we have marks based on our filter selection. This means we need a little trick to concatenate all our filter selections into a single string for [Market], [Country], [Category] and [Sub-Category].
Let’s start with our Apply button. We add the dimension [Market], [Country], [Category] and [Sub-Category] to the detail shelf, as well as an ad-hoc calculation for “Apply.” We also immediately add the [zzTrue] and [zzFalse] calculations we need for de-highlighting. Both calculations simply contains TRUE and FALSE. For a more detailed explanation, see part 5 of the blog series.
Now for the trickier bits: let’s focus on the dates first. We need to sets of date parameters. The ones visible on the dashboard are placeholders that the user can change, whereas the second set is used in filtering the map itself. This is to prevent the map changing immediately when the parameters visible on the dashboard are changed. Right click in the parameter area of the data pane and create the first date parameter:
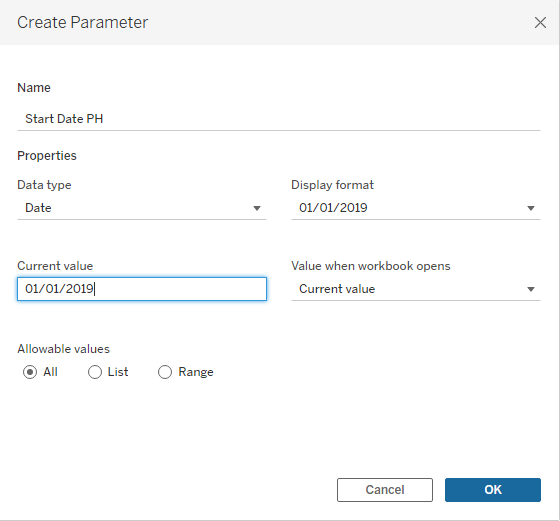
Repeat this so we end up with four parameters [Start Date PH], [End Date PH], [Start Date] and [End Date]. Drop the PH variants on the detail shelf of the Apply button as well.
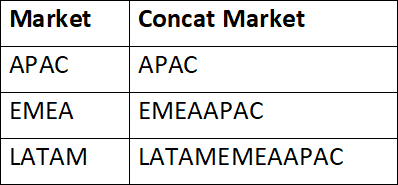
Now for an even more tricky bit, the concatenated filter values. We have our original dimensions [Market], [Country], [Category] and [Sub-Category] already in view, and we now need a table calculation that will concatenate these values. The slightly obscure function we need is PREVIOUS_VALUE. My colleague Sebastian did a brilliant blog on that one, but in brief, this function is self-referring as it will return the previous row’s value of itself. A calculation like this “MAX([Market]) + PREVIOUS_VALUE(‘’)” goes down along the rows of our view, takes the value for [Market] in that row and add the value of the previous row (cumulatively) to the value for [Market] of the previous row:
We need to make it a bit more sophisticated than this as 1) we need a separator (duh), but also 2) since we have [Country], [Category] and [Sub-Category] too, the same [Market] is repeated many times over in the underlying data for our Apply button across these other dimension. We only want to concatenate distinct values once.
With that logic built-in, our calculation looks like this:
IIF(CONTAINS(PREVIOUS_VALUE(”),MAX([Market]+’,’)),”,MAX([Market]+’,’))+PREVIOUS_VALUE(”)
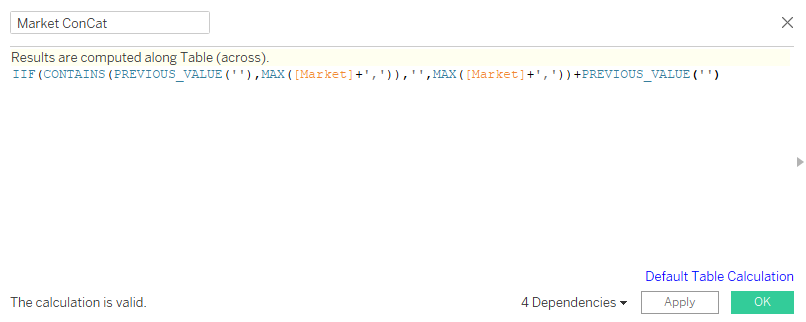
Let’s explain: If the previous row of this calculation contains the same [Market] (plus comma) as the current row, ignore it (using two single quotes). Otherwise, take the value of [Market] of the current row with a comma. In any case, tag the previous row’s value onto it. Note: The single quotes argument to PREVIOUS_VALUE is the value that is returned for the first row since there is no previous row yet. In this case, it’s an empty string.
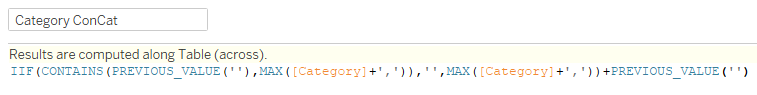
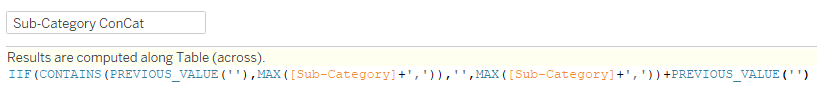
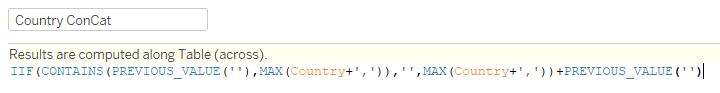
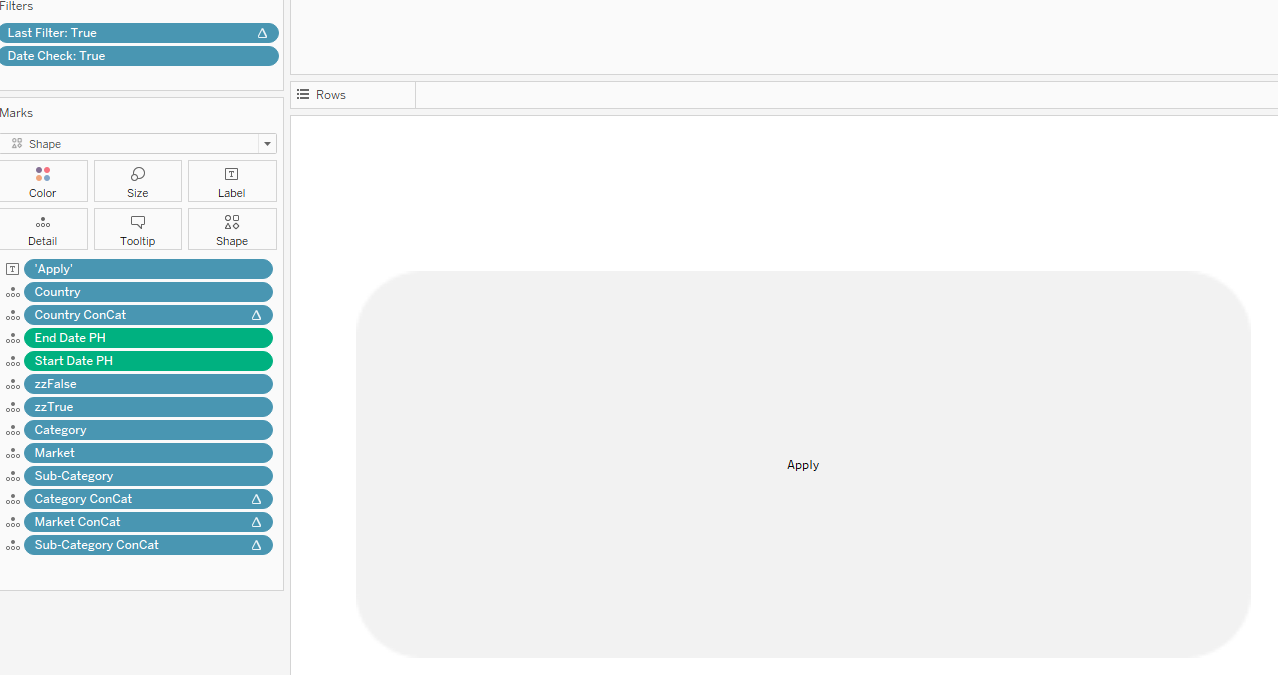
We need to repeat this calculation for all our relevant filter dimensions and then add all four to the detail shelf of our Apply button sheet:
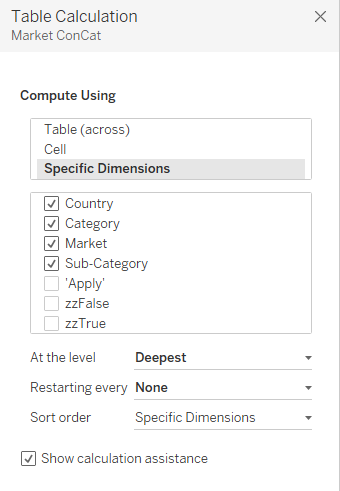
For all four concatenating calculations, it’s very important to ensure that we set the “Compute Using” to “Specific Dimensions” and select all four relevant filter dimensions:
Now for the Apply button filters. First, we need to make sure only one mark is visible at any time to prevent duplicate Apply buttons. Since all our filter dimensions are concatenated along our dimensions, we basically need to tell Tableau to keep the last row only:
Last() = 0
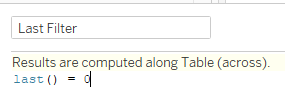
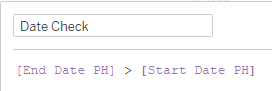
Drop this one on the filter shelf, set the “Compute Using” to “Specific Dimensions” and select all four relevant filter dimensions again, and make sure it’s filter to True only. The next one is a bonus filter. We want to make sure the Apply button is only visible when the [End Date PH] is after the [Start Date PH]:
[End Date PH] > [Start Date PH]
What we won’t do is adding in the filter for [Market], [Country], [Category] and [Sub-Category] yet. This has to do with how our Reset button will work. (More about that in a bit.) What we do need to do before our Apply button sheet is an Apply button is to change the Mark type to a Shape. I’ve added a custom Shape that looks like a button to my Tableau Repository Shapes folder:
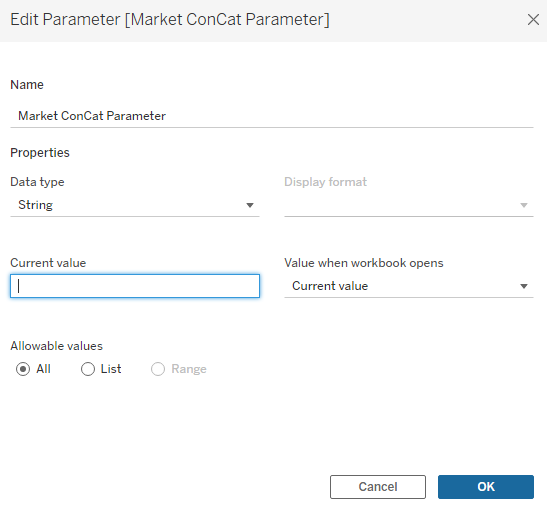
Let’s move to our Map sheet itself and add the actual fields that will filter the map. First, we need to create another four free-text parameters that will store the concatenated [Market], [Country], [Category] and [Sub-Category] strings from our Apply button sheet when the user clicks apply. They are all the same, just referencing the filter dimension in the name:
Rinse and repeat for the other three, and then we wrap these parameters in boolean filter fields like this:
CONTAINS([Market ConCat Parameter],[Market])
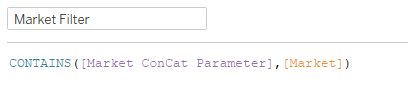
Again, rinse and repeat for the other three and add them to the filter shelf on the Map sheet. Also, we need a Date filter:
[Order Date] >= [Start Date PH] and [Order Date] < [End Date PH]
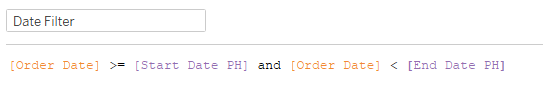
Drop them onto the filter shelf, set to True and then we move on to our Reset button:
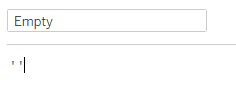
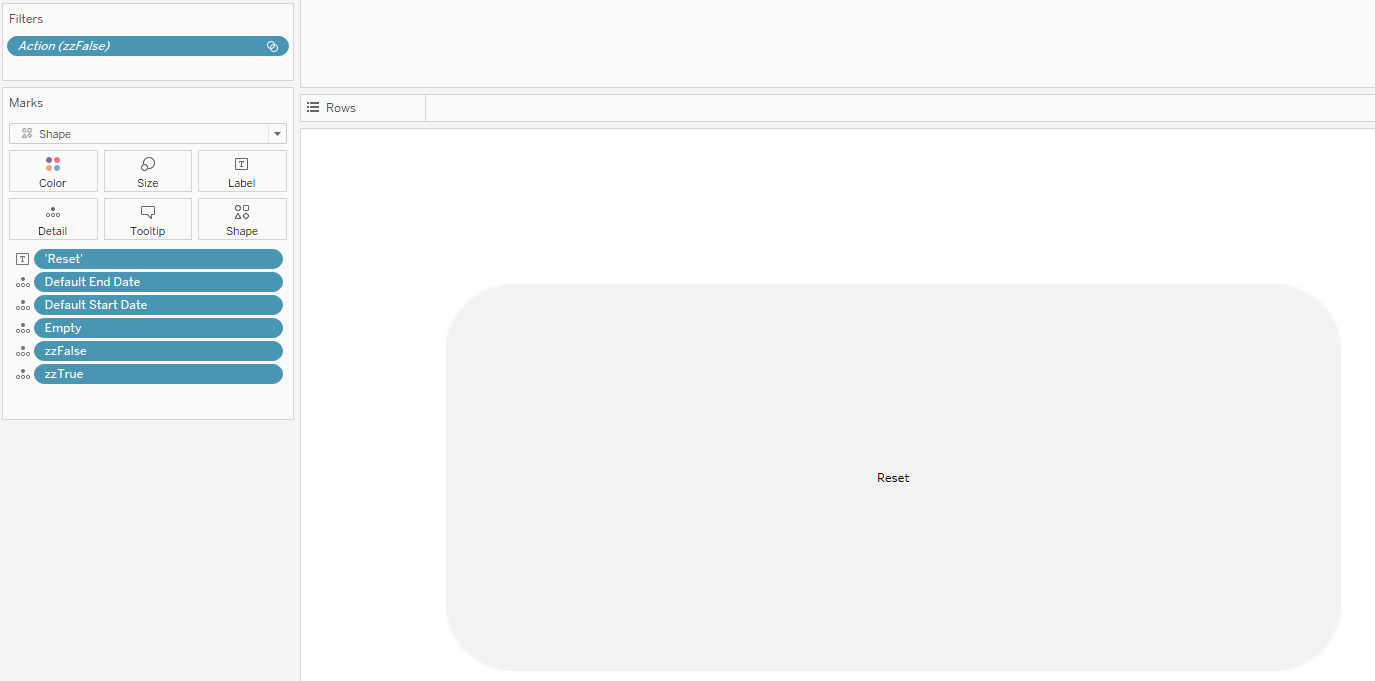
For the Reset button, we start with the basics. Create a new sheet, add a “Reset” label, and add the [zzTrue] and [zzFalse] fields for de-highlighting. Next up, we add a new dimension called “Empty” that contains just two quotes—an empty string. This is to Reset our filters to none:
Two more fields are needed to Reset our Start and End date parameters. We will use Level of Detail calculations to fix these to a single date regardless of what is in view.
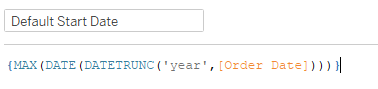
The Default Start Date {MAX(DATE(DATETRUNC(‘year’,[Order Date])))} will give us the first of January as the maximum date in our dataset.
The Default End Date {MAX([Order Date])} gives us the maximum date in our dataset:
Drop them onto the Detail shelf so we can move over to a loooooong list of actions to make this actually work:
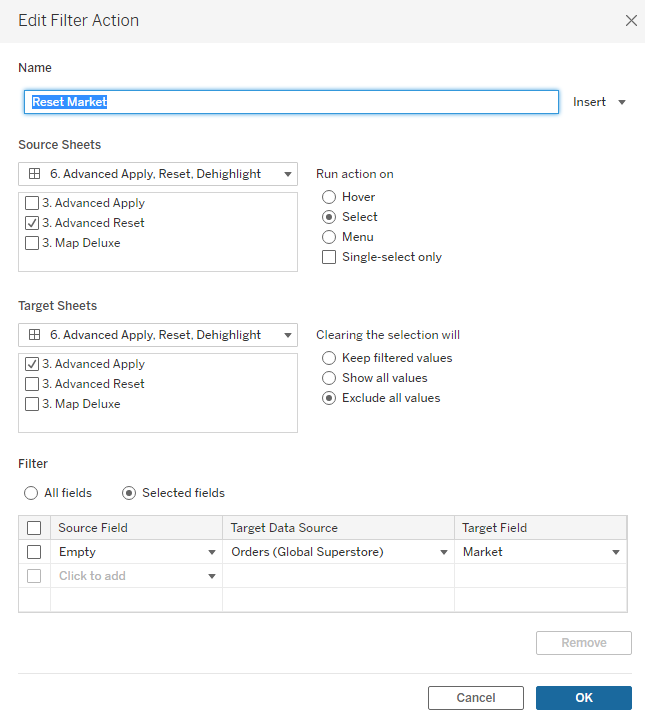
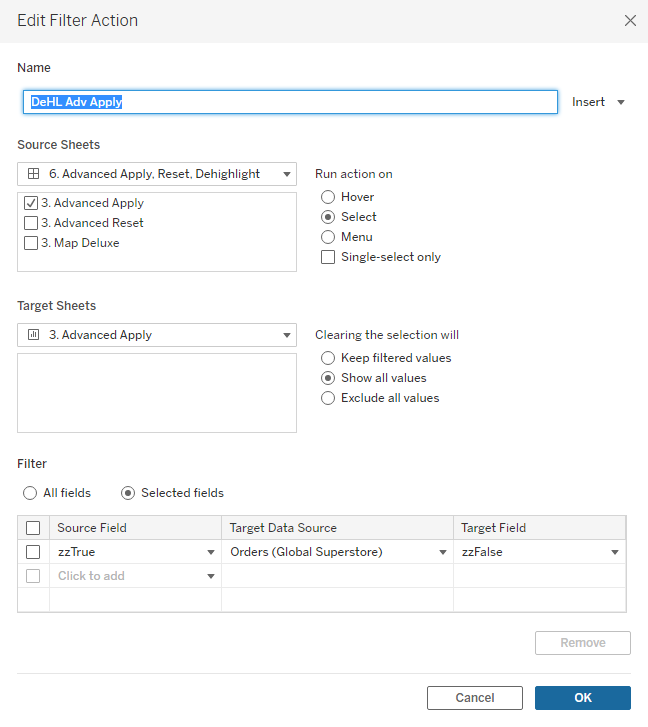
Let’s drop the Map view and the Apply and Reset button sheets onto our dashboard if we haven’t done so already. We will than first set up our Reset action filters. When we pass the “Empty” value from our Reset button to [Market], [Country], [Category] and [Sub-Category] on the Apply button, the action filters will appear on the Filter shelf of the Apply button sheet itself. This, in turn, means that we can make the read-out of the Action filters visible as normal quick filters on the dashboard—filters than can be controlled by selecting and deselecting values AND by the reset button through a filter action. To make sure these can be individual filters, every action needs to be a separate action too, so repeat this Filter Action for all four Target fields, [Market], [Country], [Category] and [Sub-Category]:
Click the Reset button once. The Action filters have now been created and you can add them as quick-filters to the view:
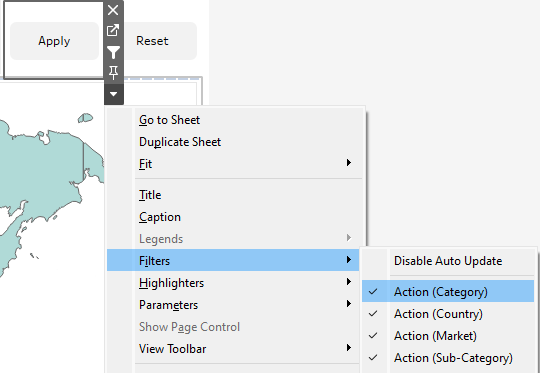
You can rename them in the view if you like. I would name them like the fields they filter as normal quick filters.
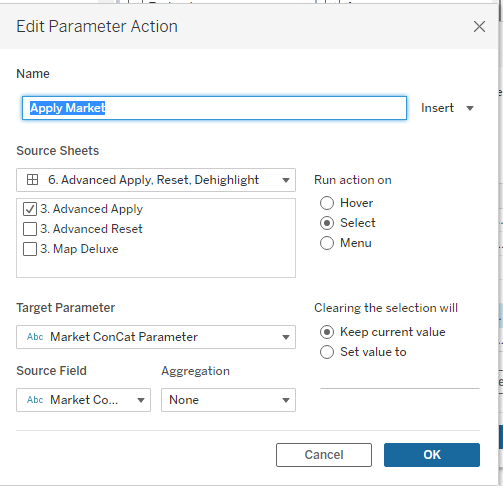
Next, all the other actions. First of all, the Apply actions. We need 4+2 parameters actions to apply the Concatenated Market, Country, Category and Sub-Category string to our Concatenated Market, Country, Category and Sub-Category parameters, as well as to Apply the [Start Date PH] and [End Date PH] to [Start Date] and [End Date]. For the first four, we apply the [Market ConCat], [Country ConCat], [Category ConCat] and [Sub-Category ConCat] to the [Market ConCat Parameter], [Country ConCat Parameter], [Category ConCat Parameter] and [Sub-Category ConCat Parameter] respectively.
Applying the [Start Date PH] and [End Date PH] parameters to the [Start Date] and [End Date] parameters works exactly the same. The Source Field is just a parameter instead of a field:
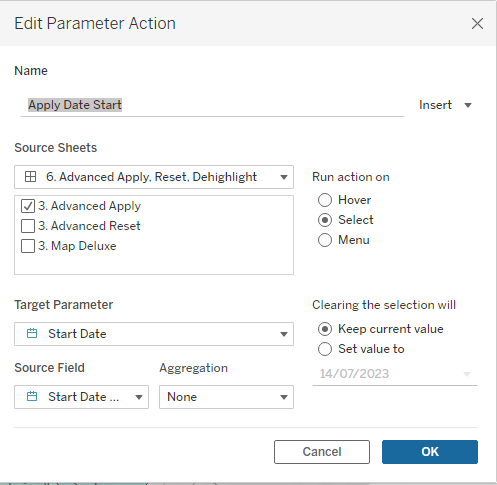
Repeat for the other three ConCat parameters and, obviously, the End Date parameter too.
Going back to the Reset actions, apart from clearing out the filters applied to the Apply button sheet, we also need another action to empty the ConCat parameters at the same time. This is pretty straightforward, we use Parameter Actions to apply the Empty field to the Target ConCat parameters:
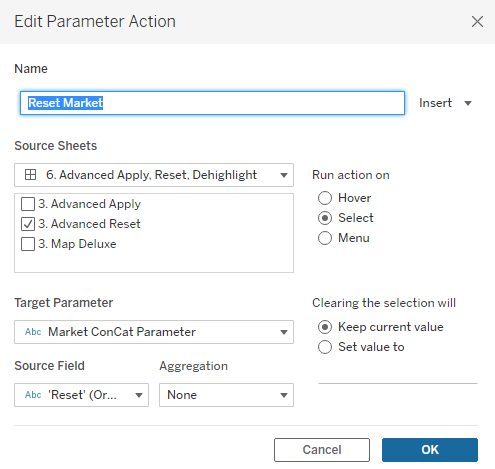
By now, you know that these also need to be applied in exactly the same way to the other three ConCat parameters.
We have implemented the Apply Parameters Actions, Reset Filter Actions and Reset Parameter Actions, so that means the final actions to implement are the de-highlighting Filter Actions for both the Apply and Reset button sheets. The important thing to remember for these final two actions is that the Source Sheet is the Apply/Reset button sheet on the dashboard, but the Target Sheet is the Apply/Reset button sheet itself:
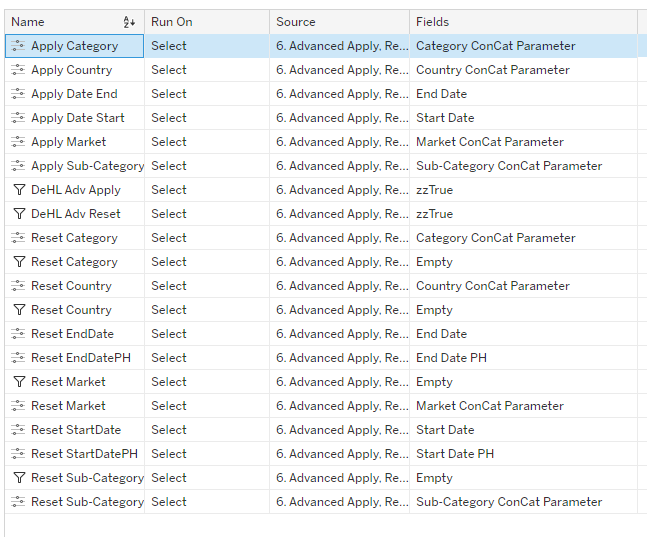
For completeness, here is the full list of all the Actions that we have applied to our dashboard:
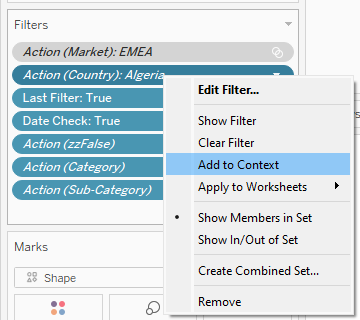
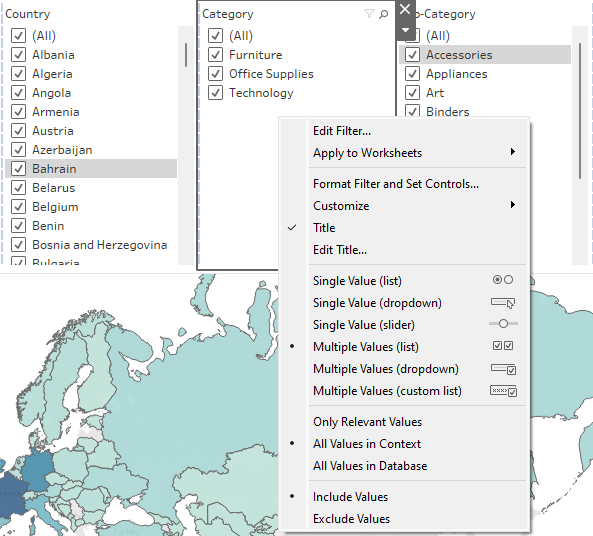
There are some final little tweaks I’d like to make: Adding the [Market] and [Country] filters on the dashboard (applied to the Apply button) to the Context, so I can make the [Country] and [Category] filter show Values in Context only, and then make the [Sub-Category] filter only show relevant values. This will give the filter actions a nice flow. Adding the filters to Context needs to be done via the Filter shelf on the Apply button sheet itself. Then, on the dashboard, we need to change the [Country] and [Category] filters to show only Values in Context and the [Sub-Category] to show Only Relevant Values:
Check out the full dashboard here: