Sometimes, we want to calculate summaries of our data that cannot be calculated at row level, but need to be calculated at the level of aggregation in our view. We can use Level of Detail calculations for some of these calculations. For example, if we want to calculate Averages of Sums. Other times, we need to use window functions which gives us a single answer across many data points and the level of aggregation currently in view.
In the example below, I use a WINDOW_MIN and a WINDOW_MAX calculation, where the WINDOW_MIN is computed down the whole table and the WINDOW_MAX is computed down the pane – which in this case means it is calculated down the Sub-Categories only and restarts every Category:
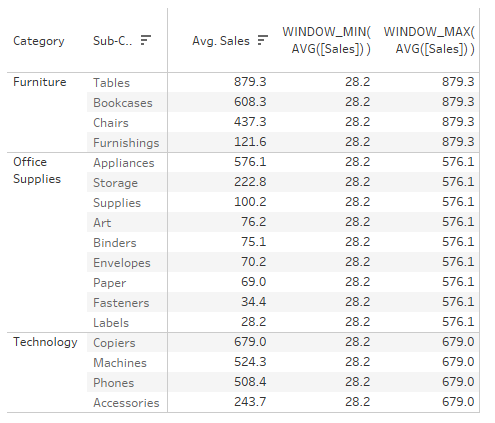
Both WINDOW functions can also be calculated using Level of Detail, but since we are already displaying the AVG([Sales]) by Category and Sub-Category in view, it is often more performant to reuse the values already in view. When we are only interested in the summary values itself, it would be easier to use a Level of Detail calculation. Otherwise, we would normally end up with duplicated values across the categories in view. But in other cases, where we would like to see the ratio between the AVG([Sales]) by Sub-Category and the minimum of these AVG([Sales]) across Sub-Category, we are better off using the WINDOW functions.
For some table calculations, there are no Level of Detail equivalent calculations, such as RUNNING or RANK functions. These are calculated using new individual data points in relation to neighbouring data points and, as such, do not summarise the data. Some WINDOW functions, although they summarise a number of data points, do not have a Level of Detail equivalent, such as the WINDOW_PERCENTILE function, which will return the percentile for the value you specify across the data in your view or a subset thereof. As such, resulting summary value is duplicated across every row, column or mark, which is often not needed.
The simplest way around this is an additional table calculation placed on the filter shelf that will filter out all duplicates after your WINDOW calculation is calculated. These table calculations work by telling tableau to only keep the first (or last in some cases) row, column or mark. For example, FIRST() = 0 OR INDEX() = 1.
If you have multiple WINDOW CALCULATIONS, you need to calculate them all separately and put them on the measure values shelf if we want to put them in a crosstab. Since they are separate measures, we can set the filter to only keep the first row. Normally this is fine, so let’s start out with this scenario.
The Setup
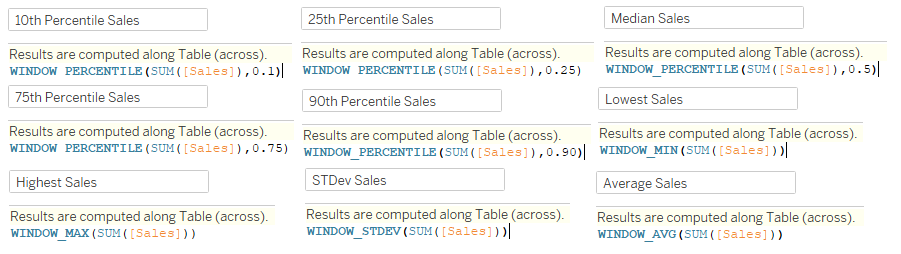
We are interested in knowing the 10th, 25th, 50th (median), 75th and 90th percentile of SUM([Sales]) on Order level ([Order_ID]), For completeness, we also want to know the Standard Deviation and the Average.
We can use WINDOW calculations. They are calculated across all the values currently in the view, which is the Order level, since they are calculated over the SUM([Sales]) for every Order. Have a look at the screenshots below for each calculation (which will eventually become helper calcs when I use the coat hanger method later):
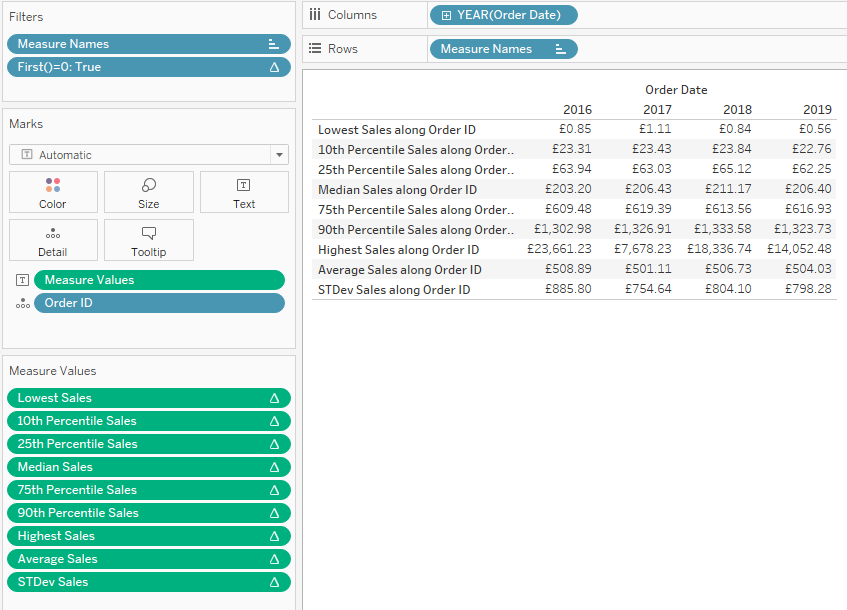
After creating the calculations, we add [Order_ID] to the detail shelf and add all these calculations to the view, ensuring they are calculated across the [Order_ID]. We also add the Year of [Order Date] to the view across, but don’t add them to the dimension of the individual window calculations, as we want to recalculate them all by year. Finally, we add the filter calculation FIRST() = 0 to the filter shelf as well to filter to the first [Order ID] only:
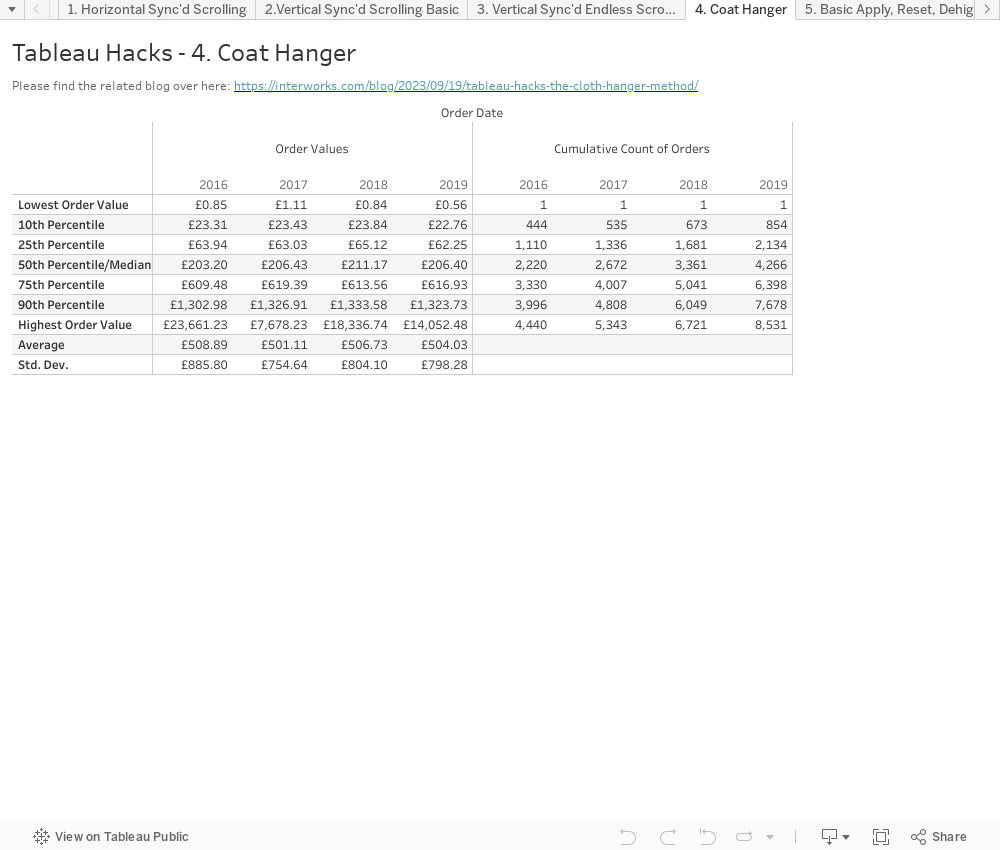
We want to know a bit more about the context of these values, such as the number of orders up until each point. For example, how many orders are included up to each percentile—a cumulative count up of [Order Id] for every calculation we’ve already made. However, these would all be again separate calculations and it would look like this:
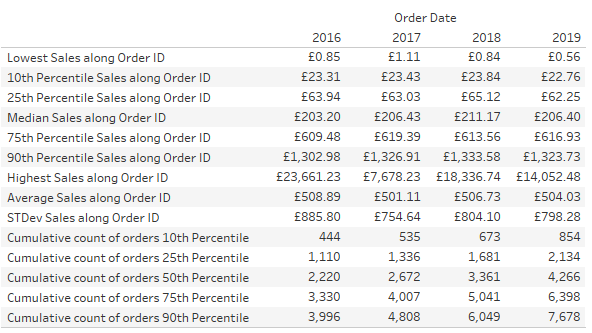
Doesn’t look great, right? We need to look up and down the table to see which cumulative count belongs to which percentile. We could create a separate view instead and line them up on a dashboard. Or, we could use the Coat Hanger™ method.
The Coat Hanger method is a way of wrapping all these WINDOW calculations into a single field by not only using the first row, but by applying these calculations to the first as many rows as we need. In this case, we have nine calculations to start with, so let’s use the first nine rows/orders in the list to create a single calculation for the initial fields first.
We start by creating a new view including [Order ID] on the Detail shelf and YEAR([Order Date]) on Columns. We also need an INDEX(), which is, in fact, another table calculation that assigns numbers from one onwards to your data points in view. You can specify when to restart and in what direction if needed, but we will tell Tableau to calculate it using the [Order ID] and ignoring the YEAR([Order Date]) to make it restart for every year. If we make this INDEX() visible, it looks like this:
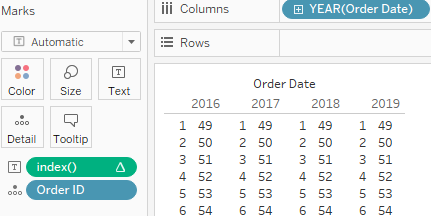
These INDEX() numbers are the coat hangers to hang other calculations on. Now we will hang the percentile, average and standard deviation onto the coat hangers. The calculation is as follows:
CASE INDEX()
WHEN 1 THEN [Lowest Sales]
WHEN 2 THEN [10th Percentile Sales]
WHEN 3 THEN [25th Percentile Sales]
WHEN 4 THEN [Median Sales]
WHEN 5 THEN [75th Percentile Sales]
WHEN 6 THEN [90th Percentile Sales]
WHEN 7 THEN [Highest Sales]
WHEN 8 THEN [Average Sales]
WHEN 9 THEN [STDev Sales]
END
As long an the [Order ID] is still in play and we ensure that this and all nested calculations are calculated across [Order ID] it will give us nine different values. We still need some labels as well and, in a similar fashion, we use this calculation for the labels:
CASE INDEX ()
WHEN 1 then 'Lowest Order Value'
WHEN 2 then '10th Percentile'
WHEN 3 then '25th Percentile'
WHEN 4 then '50th Percentile/Median'
WHEN 5 then '75th Percentile'
WHEN 6 then '90th Percentile'
WHEN 7 then 'Highest Order Value'
WHEN 8 then 'Average'
WHEN 9 then 'Std. Dev.'
END
Next up, we need a calculation to calculate the cumulative number of orders up until the seventh calculation. Since our initial calculations were already done before the coat hanger method came into play, we could just reference those in the combined calculation. But to calculate the cumulative number of orders, we can either calculate them all separately again or put them all in a single calculation. We will go for the second option and keep everything in one field.
CASE INDEX()
WHEN 1 then MAX(1)
WHEN 2 then
WINDOW_SUM(IIF(SUM([Sales]) <= [10th Percentile Sales], MAX(1),null))
WHEN 3 then
WINDOW_SUM(IIF(SUM([Sales]) <= [25th Percentile Sales], MAX(1),null))
WHEN 4 then
WINDOW_SUM(IIF(SUM([Sales]) <= [Median Sales], MAX(1),null))
WHEN 5 then
WINDOW_SUM(IIF(SUM([Sales]) <= [75th Percentile Sales], MAX(1),null))
WHEN 6 then
WINDOW_SUM(IIF(SUM([Sales]) <= [90th Percentile Sales], MAX(1),null))
WHEN 7 then WINDOW_SUM(MAX(1))
END
Quick explanation here: For the “Lowest Order Value” row, there is only one order, so we use a MAX(1). For the next five rows, we flag all orders where the Order Value is less than or equal to the Percentile Order Value for that row with a 1 (MAX(1)) and then sum these 1’s up across all orders. For the last “Highest Order Value,” we simply flag all orders with a MAX(1) and sum all of them up.
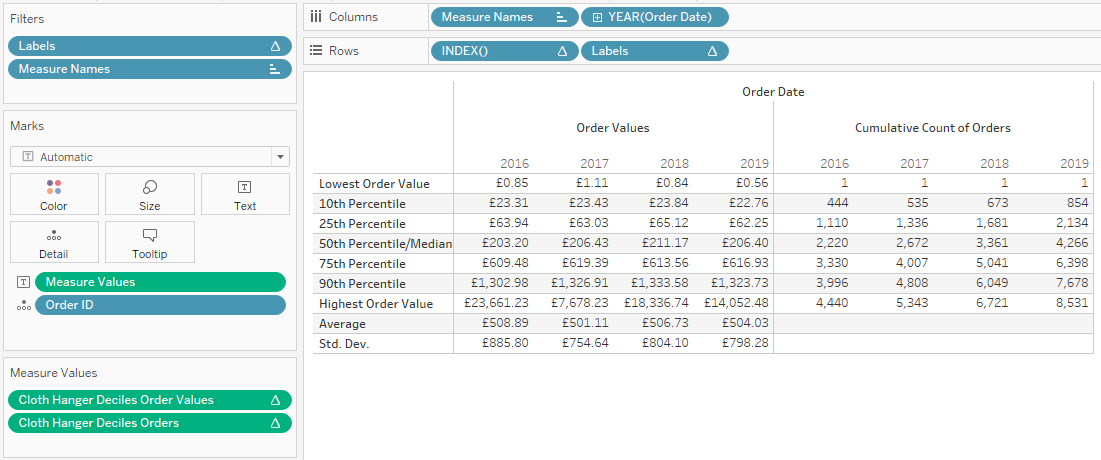
We bring all of this together by putting the INDEX() on the row shelf to ensure these calculations stay in the right order, put the label field next to it, and put the percentile and count of order calculations on the measure values shelf. We don’t want any additional [Order ID]‘s lingering in the background as we only need [Order ID]‘s with Index 1 to 9 in our view – we can either drop the [Labels] calculation on the filter shelf and exclude “Null” or drop our INDEX() on the filter shelf and limit it to nine. Again, make sure that everything is calculated using [Order ID]:
You can find the workbook here: