
Our Certified Tableau Trainers are asked a myriad of questions each day. In this series, they share some answers.
Today I received another interesting question from Suzanne, a student during a virtual training.
“I want to include a specific value in a top ten list, even if it’s not in the top ten.”
In other words, our goal is to make sure that particularly important values in our list will always show even if we’re looking at top N results. It’s a great question and immediately got me excited about finding an easy solution. So, here it goes!
Top N Starting Point
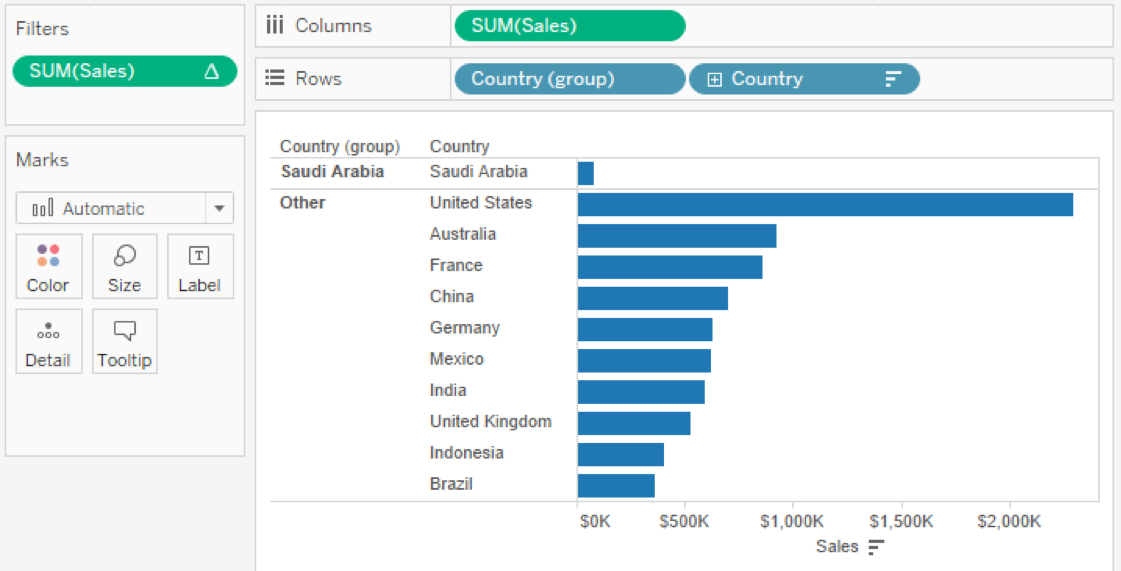
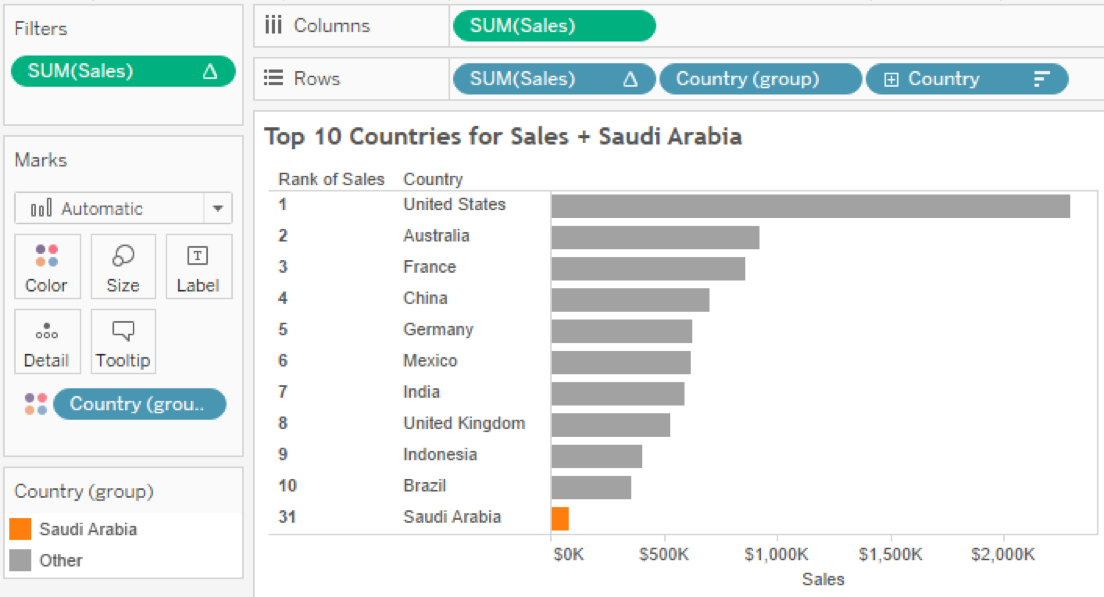
Here’s our starting viz, a standard list of countries showing only the top ten by SUM of Sales:
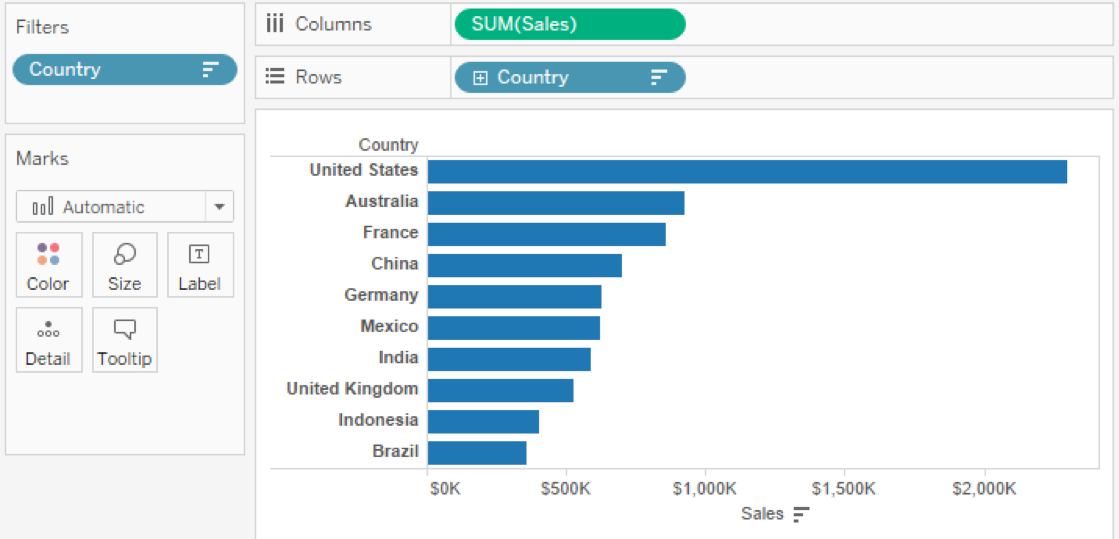
1. Top Ten Countries by SUM of Sales
Now, let’s assume that Saudi Arabia has particular strategic importance to this visualization. No matter where it stacks up in my top N list, I want Saudi Arabia to be listed.
Basic Solution
Part 1. Groups
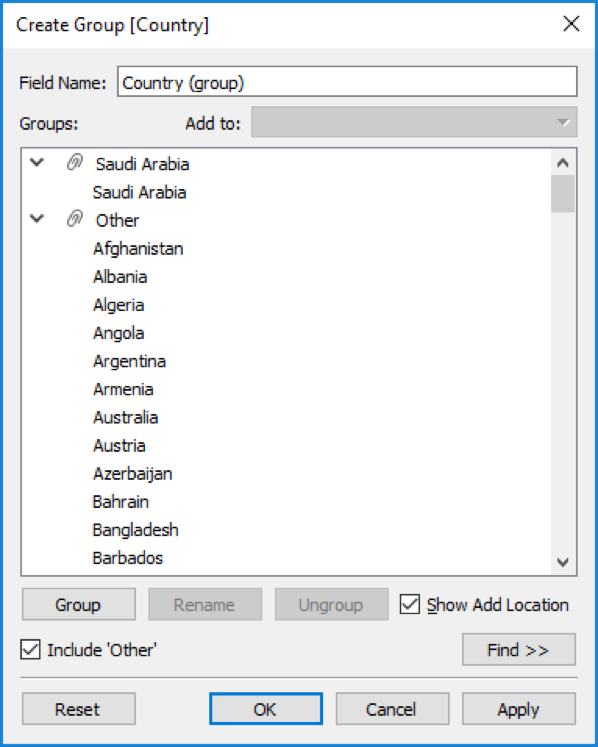
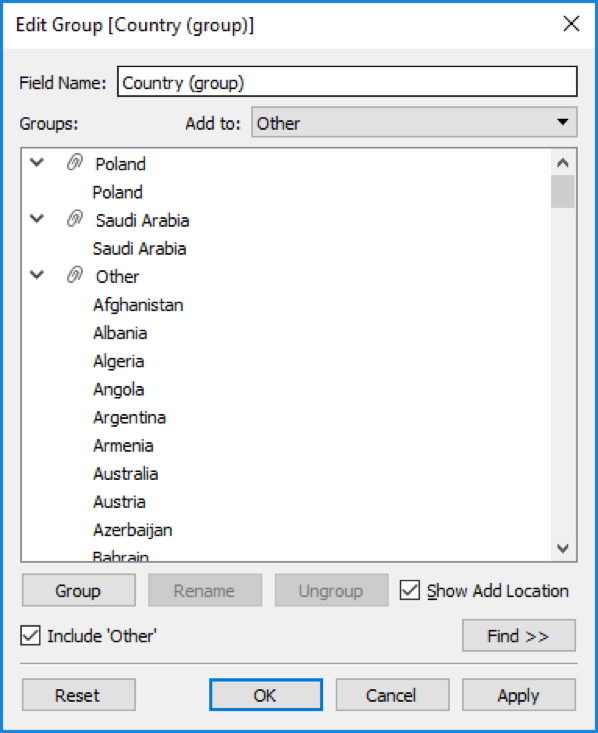
The first thing I’m going to do is remove our Country filter from the filters card. The way it’s calculated won’t work for what we need to do with our view. We’re going to tackle this solution with two Tableau Desktop features: groups and the Rank table calculation. Let’s start with our grouped field. I’m going to make a separate group for Saudi Arabia while putting everything else in the Other default group:
What I like most about this solution is that it’s applicable for additional special values beyond just one. We could designate as many specific countries that we want to see a rank for in addition to our top ten just by creating each within their own group inside of the grouped field. I’ll add this new Country (group) field to the Rows shelf before the Country dimension to get the following view:
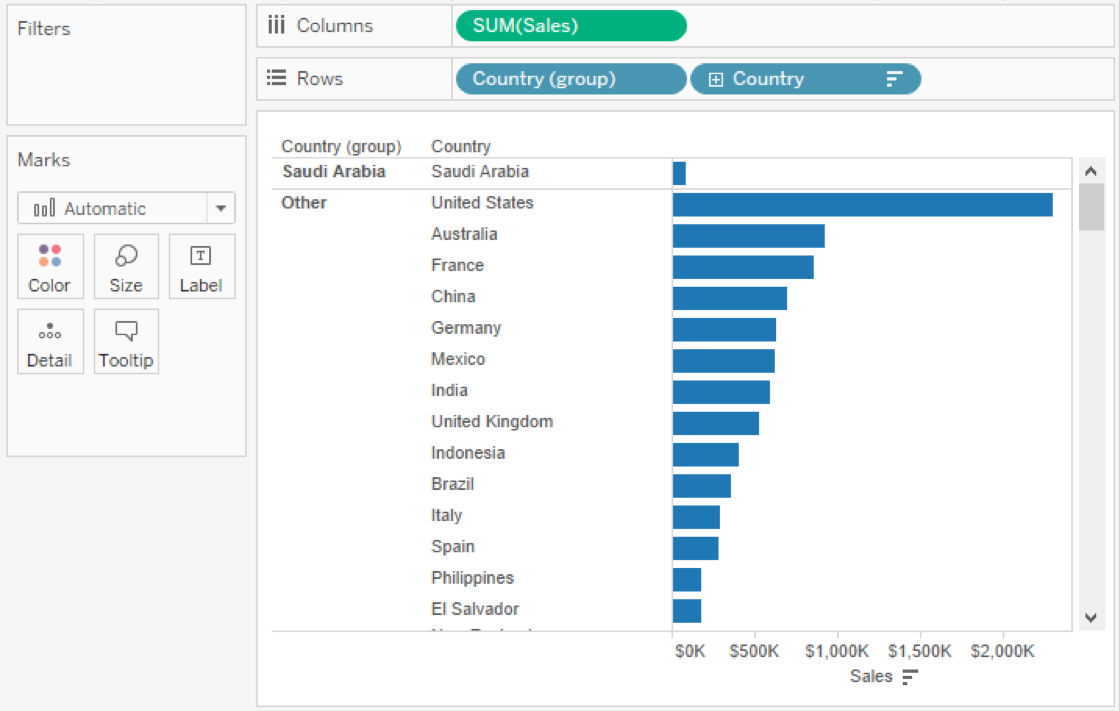
2. Adding Groups Inside the Country Field
Part 2. Rank
I need to use two instances of Rank on SUM of Sales for my view. The first one is going to limit each pane within my Country (group) field to the top ten. That works great for our Saudi Arabia group, because there is only one field there. Here’s how I’ll set up that table calculation on SUM of Sales:
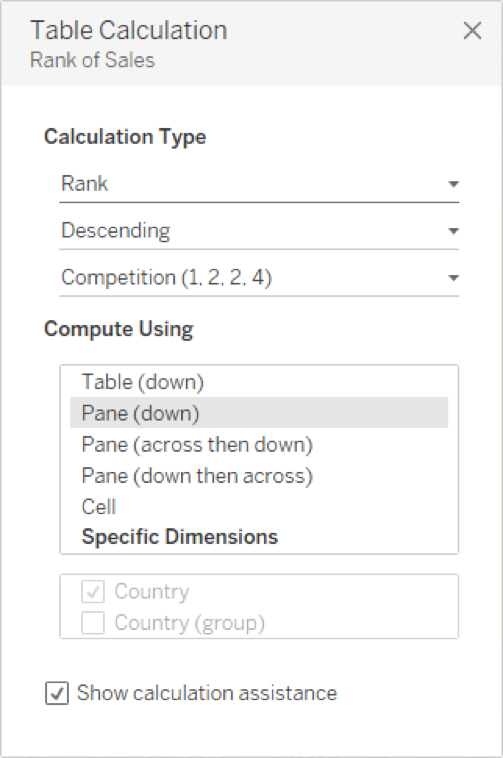
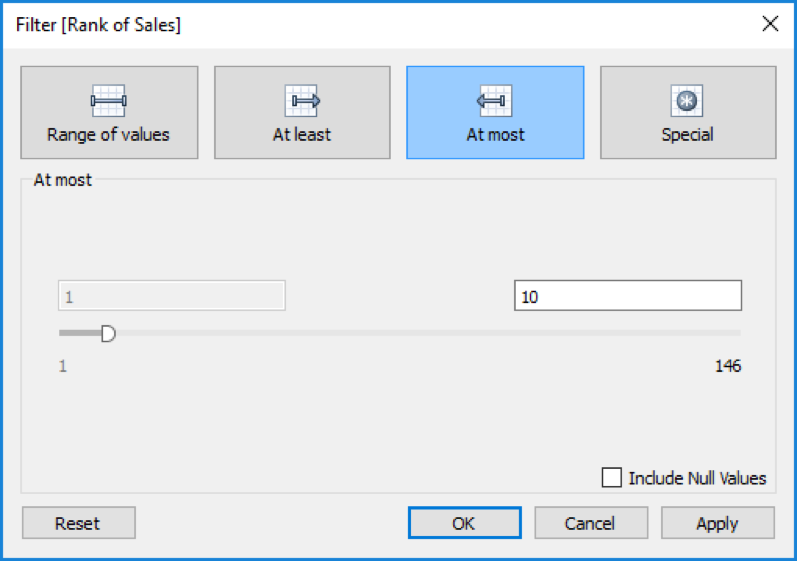
I’ll drag this instance of my Table Calculation onto the Filters card. I’ll set my Range of Values from 1 to 10, like this:
Here’s how our updated view looks:
3. Showing Top 10 Within Each Group by SUM of Sales
I’ve got my top ten showing as well as my extra value, but I need to show their rank. If I simply duplicated the current Rank table calculation on my Filters card, each pane would rank from 1 to 10. That means that Saudi Arabia would always appears #1 as it’s the only country in that pane. I’m going to CTRL + drag a copy of my Table Calculation back onto my Detail. Let’s modify our table calculation’s scope and direction to use specific dimensions:
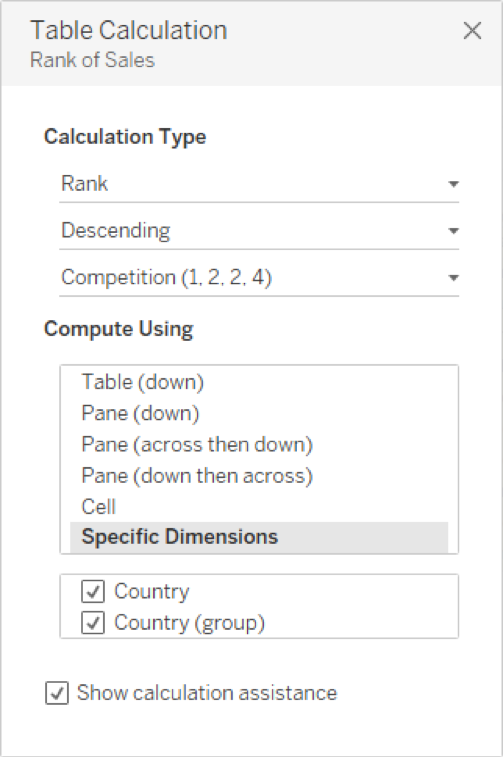
Please note that the order of our dimensions is important. We need Country to be first and Country (group) to be second. If they aren’t in this order, you can click and drag them around however you need them. Now, convert this revised rank table calculation on SUM of Sales to discrete and slot it before Country (group) and Country on the Rows shelf.
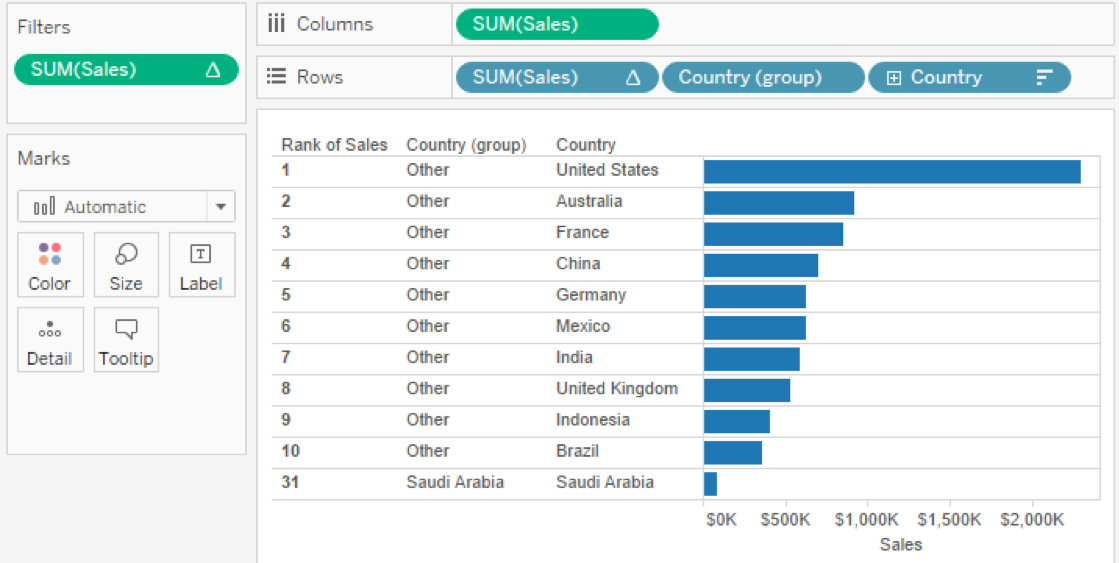
4. Showing a True Top Ten Along with an Extra Value
Part 3: Clean Up
We have accomplished our goal. Now, let’s just polish up our view by, 1. hiding our header for Country (group), 2. reducing our Row
Dividers to the lowest level, 3. adding our Country (group) field onto Color and 4. a worksheet title. And here’s our finished product:
5. Adding Visual Emphasis To Our Extra Value.
This solution works even with additional dimensions nested onto our rows, like Category. Note how Saudi Arabia’s rank changes within each Category for its relative rank within the pane.
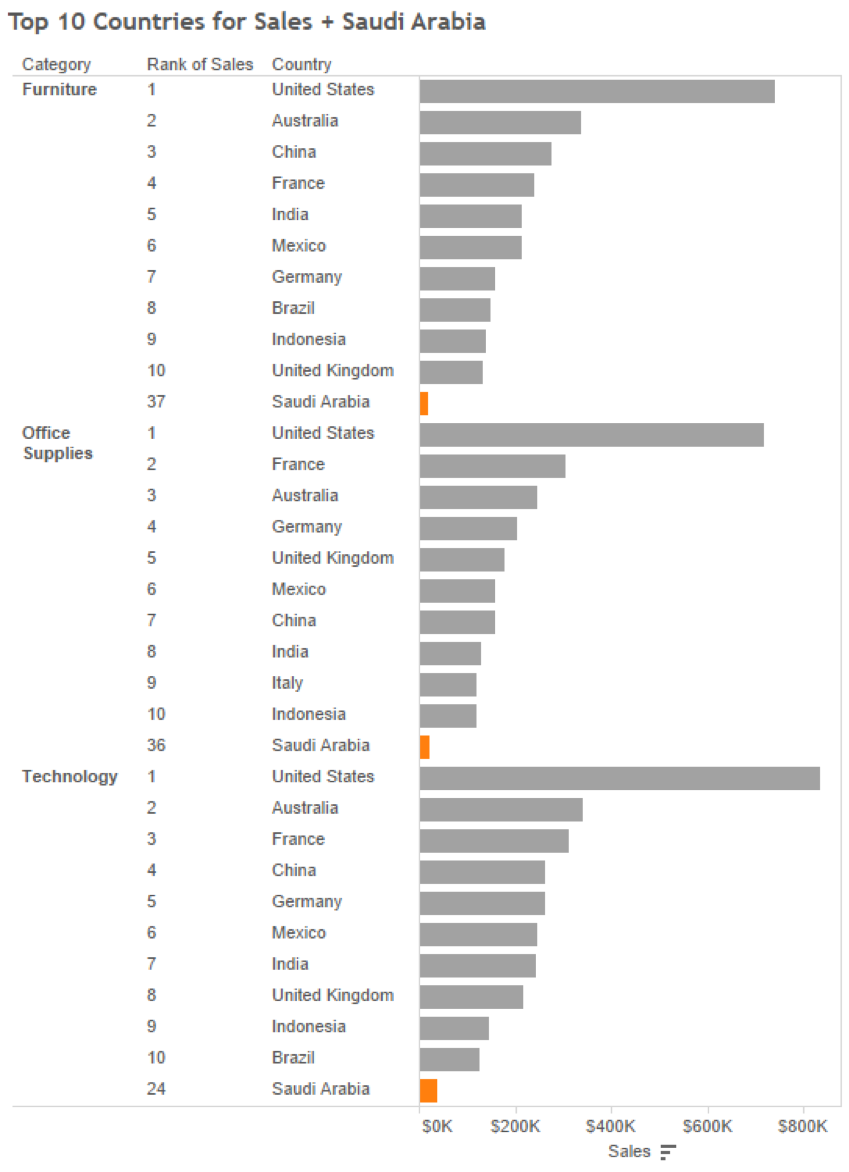
6. Solution Works with Scope of Pane as well as Table
Advanced Solution
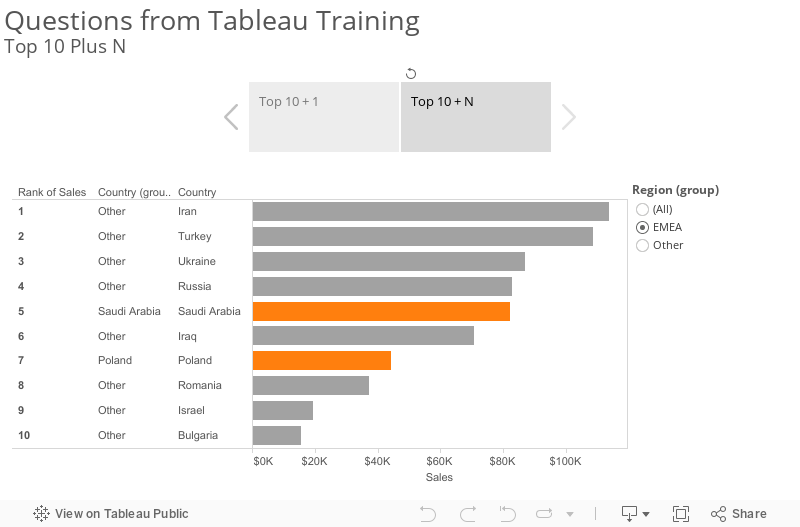
Let’s assume that there is a scenario when Saudi Arabia might end up within the top ten of our results. In that case, our solution above would actually return a top 11 (or in other words a top ten from Other plus Saudi Arabia). To illustrate this, pretend we’ve added a Region filter. When I show the ALL option, Saudi Arabia is out of the top ten. When I use the EMEA option, Saudi Arabia is now inside of the top ten. That’s not ideal, so let’s fix it.
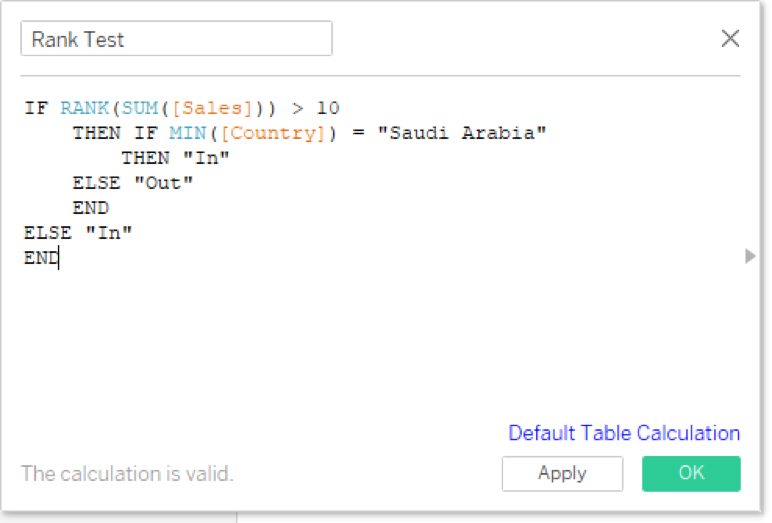
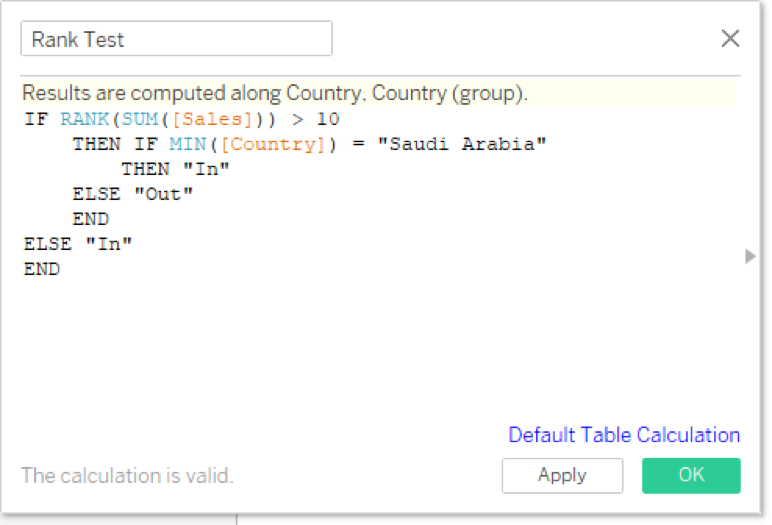
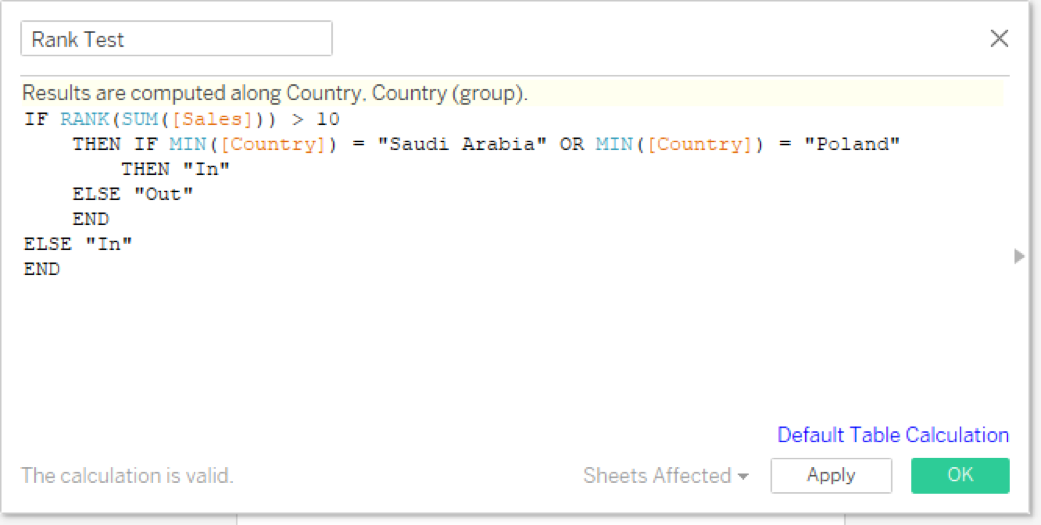
To accommodate for this, I’m going to create another Calculated Field that will test for any values that are, 1. outside of the top ten and 2. whether they are my selected special fields. Here’s my calculation:
I’ll also customize my table calculation here by clicking on the Default Table Calculation link in the bottom corner. Select Advanced under Compute Using:
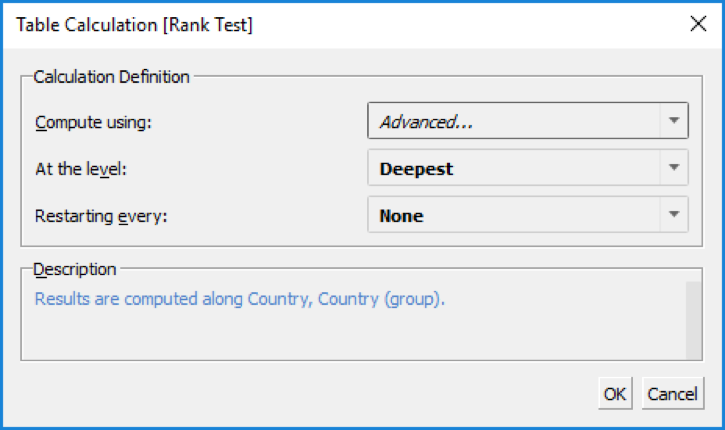
Then bring over Country and Country (group) into Addressing in that order:
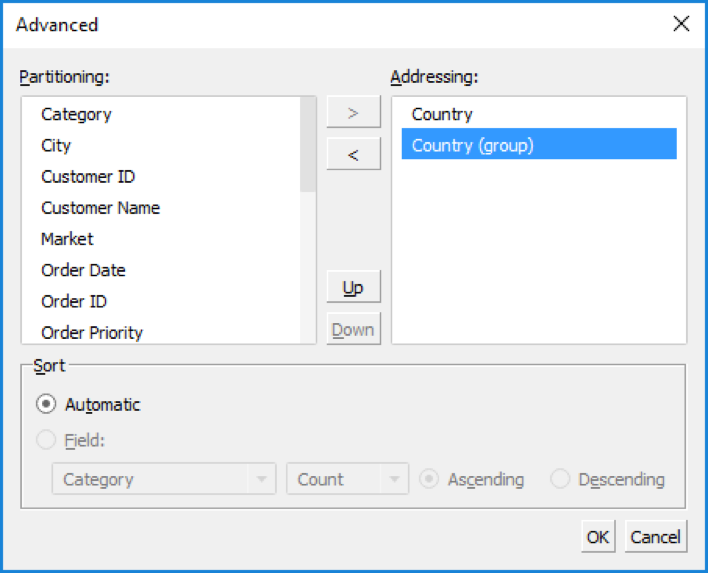
Now by default, my Rank Test calculated field is going to use the correct settings for Rank:
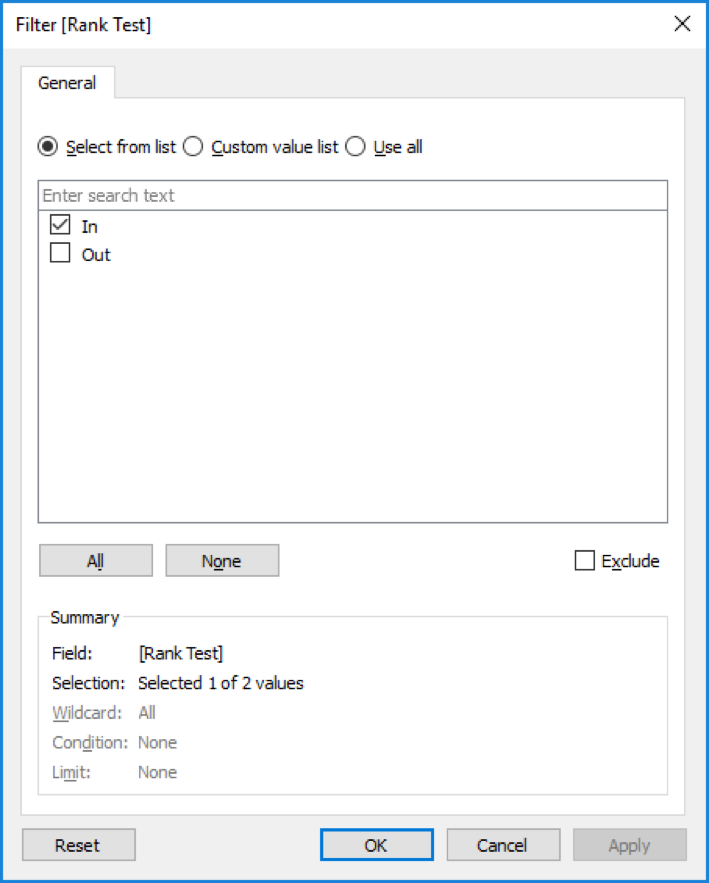
Drag the Rank Test calculation onto the Filters card and select In as the only option allowed:
That fixes our problem. Now, when Saudi Arabia is in the top ten, only ten results will show in our list. Otherwise, it will be the top ten + Saudi Arabia.
One More Wrinkle
You can see in our story above that I’ve added a second story point. Let’s say we need more than one value to show up. In addition to Saudi Arabia, how about Poland too. We only need to do two extra steps. The first is to create additional groups inside of our Country (group) field.
The second is to revise our Rank Test calculated field to also look for each additional value with an OR logic in the nested IF/THEN statement.
And that’s that! Let me know what you think of this solution or if you have any other thoughts in the comments section below. A big thanks to my student, Suzanne, for a fun question to tackle.