Our Certified Tableau Trainers are asked a myriad of questions each day. In this series, they share some answers.
The latest question from Tableau Training comes from Andy, who was in a DII: Intermediate course in Toronto, Ontario.
“I need to match the colors on my charts to my company’s style guide. Is there a way specific colors can be chosen rather than the default palettes Tableau provides?”
Picking the right colors can often make the difference between a good visual and a great visual. There are a few different approaches we can take to help Andy out, so let’s jump right in!
The Quick Fix
Using the Sample – Superstore data set that ships with Tableau, let’s build a simple graph that we can splash with color. I chose Category and Sub-Category on rows and sum of Sales on columns. A quick descending sort by sum of Sales on Sub-Category gives me a nice starting point.
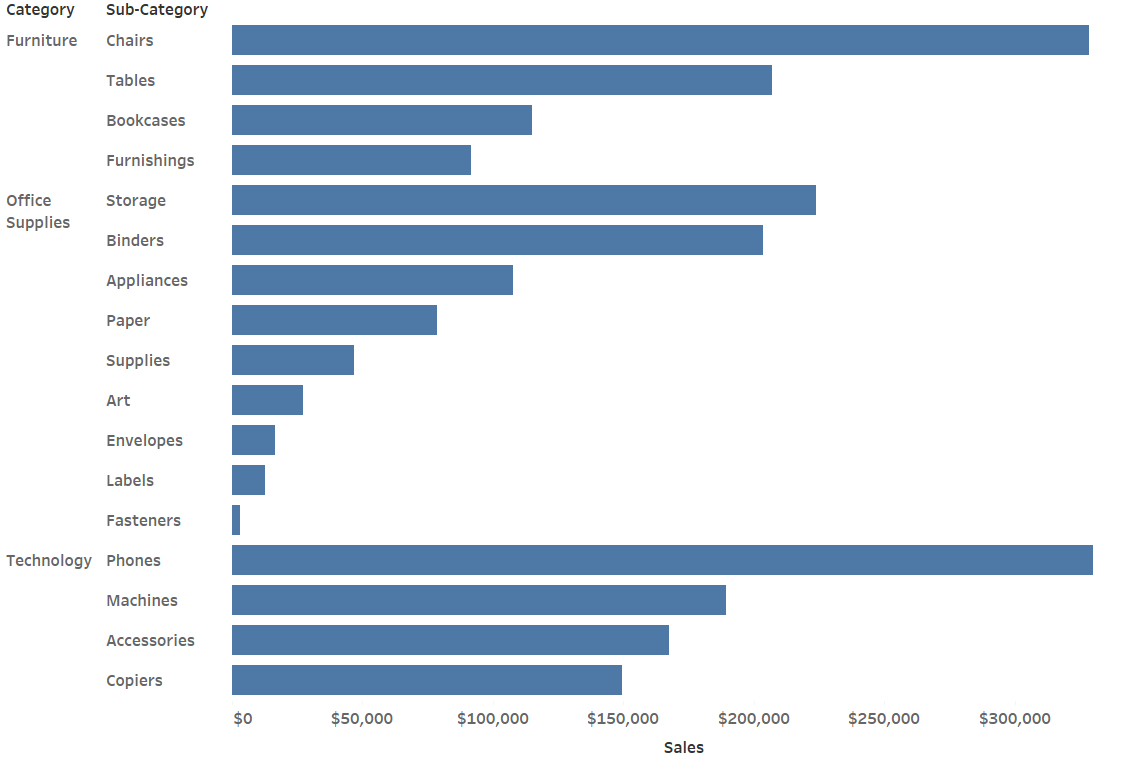
Above: Sub-Category sorted by descending sum of Sales.
Great! Now for the color. Let’s color each section of Category bars a different color to create a visual grouping. Dragging a copy of Category to color on the Marks card will do the trick.
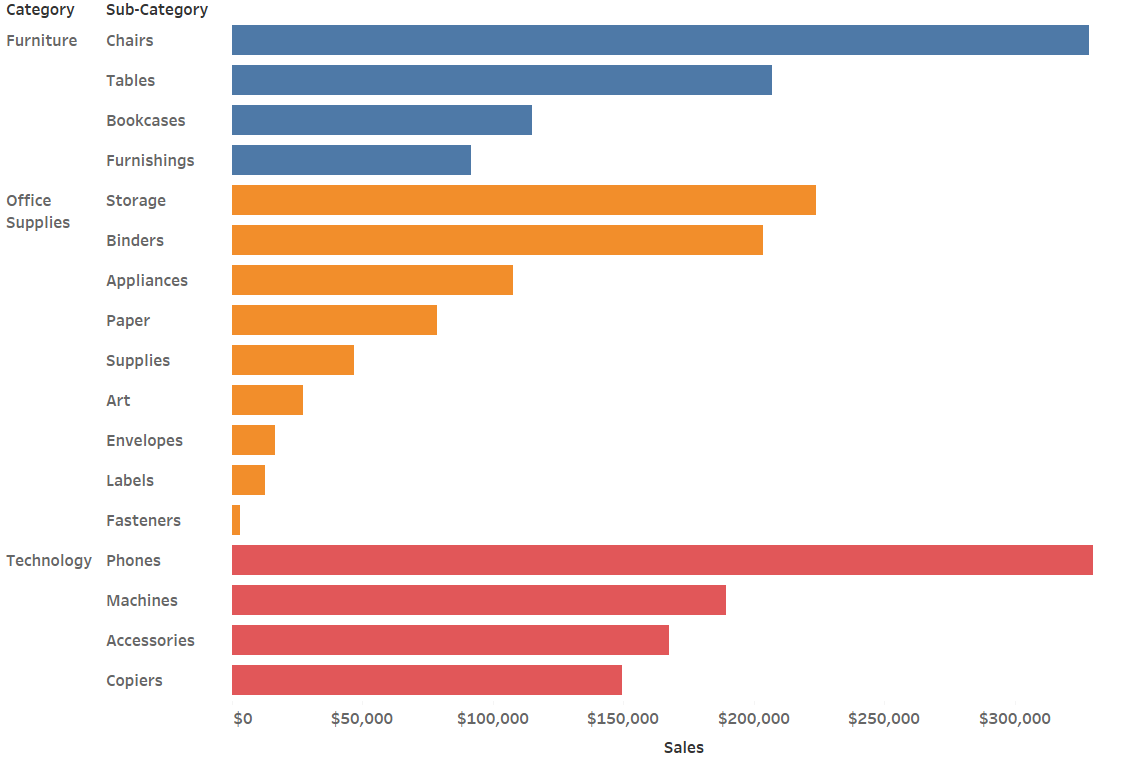
Above: Tableau automatically colors each section of the Category bars a color that matches the default palette.
Clicking the color option on the Marks card and choosing Edit Colors… grants the ability to select different colors. Notice that the colors are assigned based on how the categories are ordered. Furniture is blue since it’s the first color in the list, Office Supplies is orange because it’s the second in the list and Technology is red because it’s third.
If your business requires choosing different colors, Tableau provides many different palettes via the drop-down list at the top right. Just settle on a palette or two, click the data item you want to change then select the color.
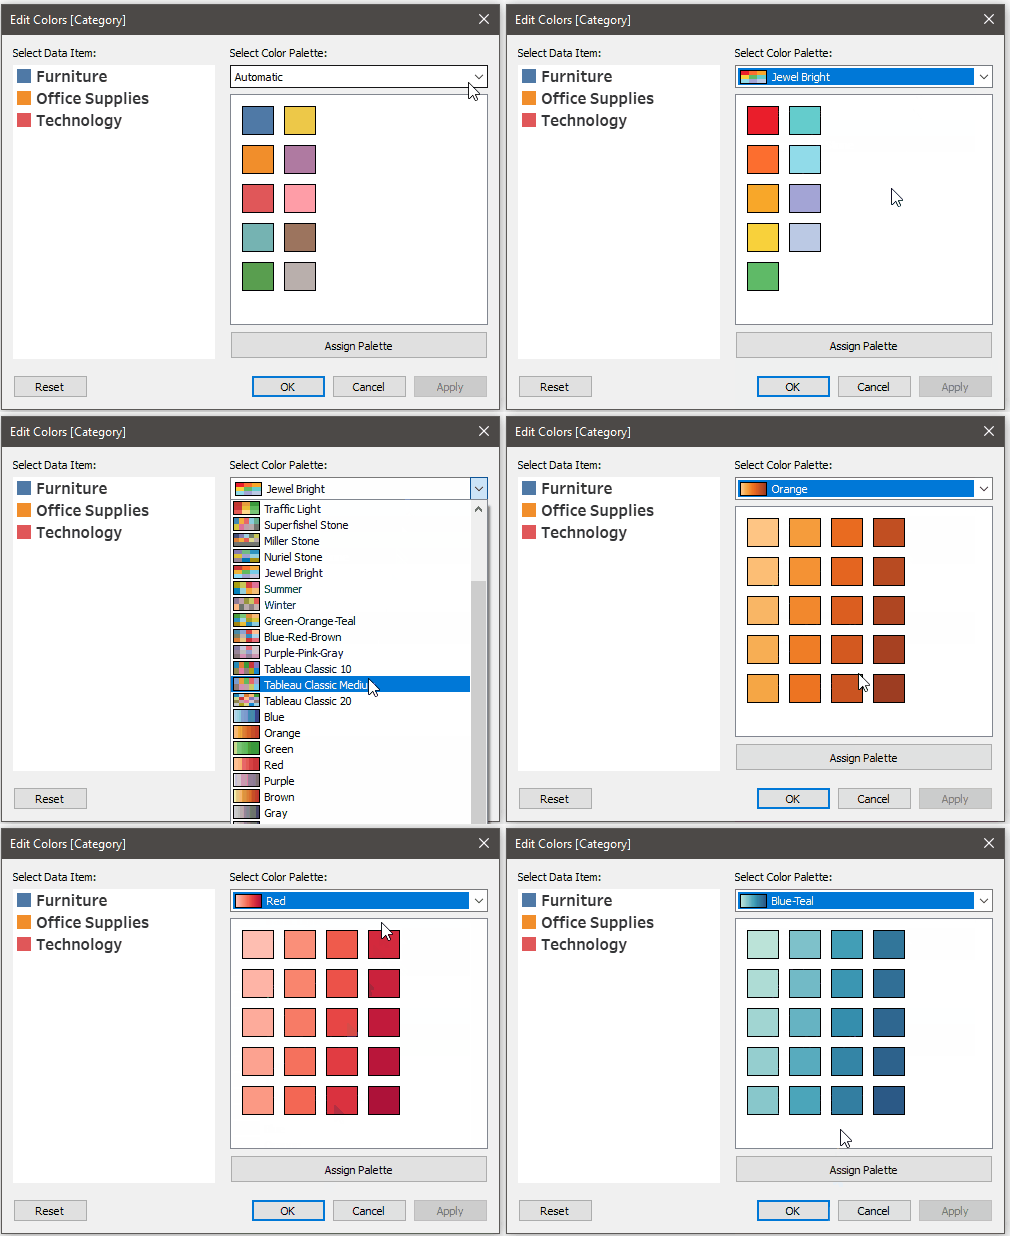
Above: Colors can be mixed and matched from different color palettes.
If the colors you need can’t be found in Tableau’s provided list, you can double-click on the data item you want to change the color of to reveal the select color menu.
From this menu, you can be more specific with your color choices, with a wider range of hues and intensities along with the option to pick a color via RGB, HSV or HTML. You even have the option to pick from a screen color, which provides an eyedropper to match color somewhere else on your desktop. I find myself using this option most frequently to match logos and specific styles.
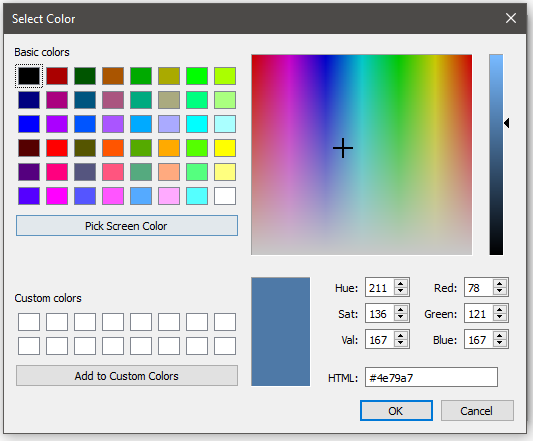
Above: Double-click on a data item to get to the Select Color menu.
Once you make your color selection, you can choose to add it to custom colors to have quick access to it in the future. You’re limited to just 16 colors at a time this way, but that should be more than enough to get you started.
The Long-Term Fix
As great as the quick fix is, there are time you want to have a concrete set of options to choose from that don’t require you to have RGB codes handy every time you start Tableau. You might also want to be able to choose from different color palettes, which may require much more than the 16 allowed by the previous method.
Fortunately, with just a bit more time investment, we can set up our own permanent color palettes like the ones I have at the bottom of my select color palette list.
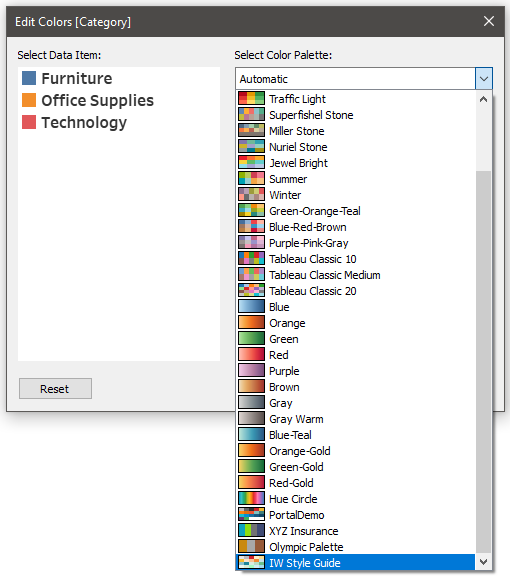
Above: PortalDemo, XYZ Insurance, Olympic Palette and IW Style Guide are all custom palettes I created and saved so that I have access to them in every workbook I open.
In order to do this on your own, we need to jump outside of Tableau for a moment. Navigate to your documents folder on your PC or Mac and locate a file called My Tableau Repository. Within that folder you should see a file at the bottom of the list called Preferences.tps.
This is a special file Tableau uses to read in custom color palettes. It will require some sort of document editor such as Notepad++ or Sublime Text to edit the Preferences file. Once the file is open, you can use standard HTML format to add in your new colors. See below for an example of my current Preferences file.
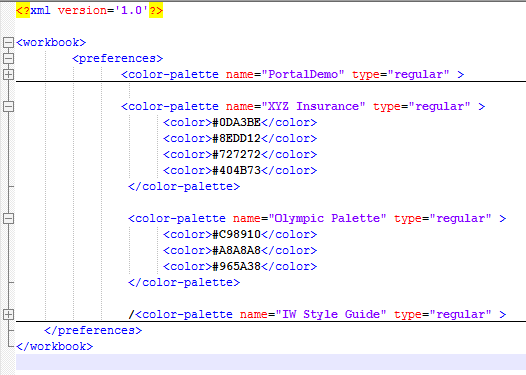
Above: Make sure to start and end your palettes with the appropriate beginning and closing tags and save the file before the palettes will appear in Tableau.
If you’re unfamiliar with using the style of coding above or your skills aren’t as good as they used to be, no worries; there is a great fix that will write all of the code for you leaving you to just copy and paste. If you haven’t heard of the Color Tool for Tableau, you’ve been missing out!
The Color Tool for Tableau was created by your friends here at InterWorks, so you know it’s gonna be legit/fantastic/revolutionary! Not only will the Color Tool for Tableau produce the code for you, it will generate a variety of color palette suggestions for single color and gradient palettes. It can even create the palettes based of an image which is great for businesses that don’t have a standard style guide. Best of all, the tool is free to use! Learn more and see some demos here.

Fantastic! Now we know a couple of different ways to change the colors of our visualization within Tableau. Time to knock the socks off our colleagues in the next team meeting! Special thanks to Andy for the great question!


