Questions from Tableau Training: Percent Change from Previous Period on a Map

Data

Questions from Tableau Training: Percent Change from Previous Period on a Map

by Grant Eisenmenger
//

Our Certified Tableau Trainers are asked a myriad of questions each day. In this series, they share some answers.

When asking a recent Tableau class about how they might use Tableau’s mapping features, I had one course member state that a view he currently uses (and is looking to transfer into Tableau) shows the % change in sales from the previous period by either a regional, state or city level of detail. He wanted to show this % change on Color and the current period’s sales as the size of the circle on the map.

For this example, I used the Orders and People sheets from the Global Superstore dataset. I added three years to Order Date so I could work with current dates; this is my [Updated Order Date] field.

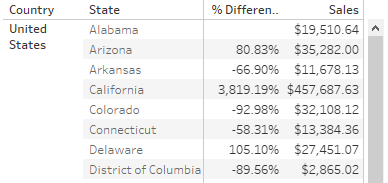
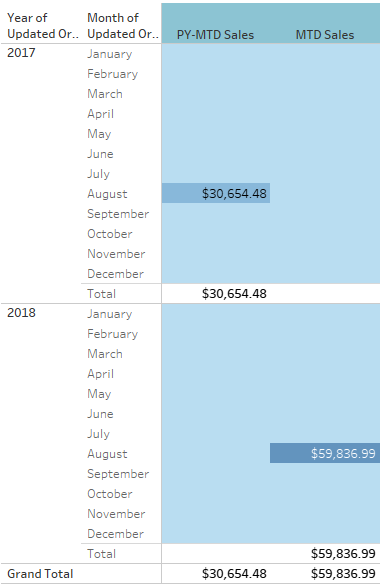
Using and editing a table calculation won’t work because the “temporary table” for a map will not include any date information; in our case, it will compute the calculation based off of the alphabetical order of the states. Like this:

Alphabetical Order in Tableau

We need to use table calculation’s cousin, the calculated field.

Creating the Parameters

I have compiled a list of date measures, like Year-to-Date, below, so I am going to skip past that part for now and jump into what I did after defining those different date measures.

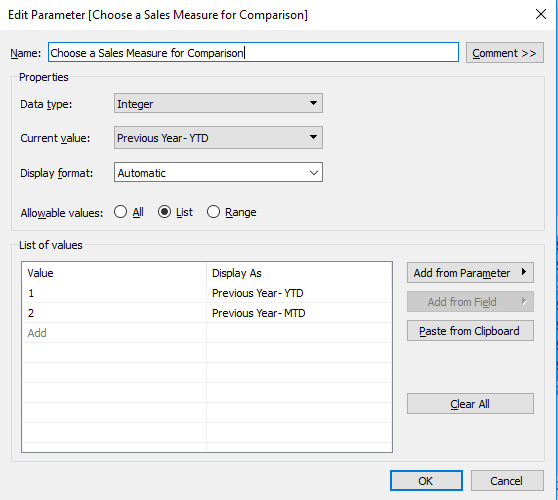
I wanted to make sure he could evaluate off different measures, so I knew parameters would come into play to give the user that flexibility. I created two integer-type parameters, with lists associating integers with different measures. The first parameter did this for current measures (YTD and MTD) while the second did it for our bases of comparison (those same measures for the previous year):

Edit Parameter in Tableau

Creating the Calculated Fields

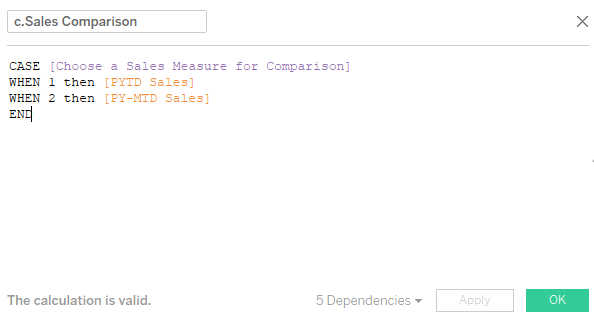
I then had to create two calculated fields referencing those two parameters. This is what actually ties the measures to the parameter; the “Display As” in the parameter dialogue box is an alias and is not actually referencing those measure fields:

Sales Comparison Calculated Field

With the two calculated fields created, I then created my % Change calculated field:

% Change in Sales Measure Calculated Field

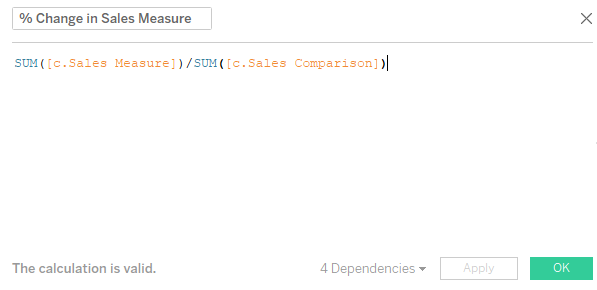
Notice that I use the SUM() aggregation here. These data points occur in different time periods, but they have been singled out by my other calculated fields, so I can simply compare their sums down at the bottom:

Compare Sums at Bottom

Creating the Map

Now for creating the actual map. My student wanted to be able to look at the data at different levels of a geographic hierarchy, including some that were specific to his organization, and by the manager in charge of a certain region.

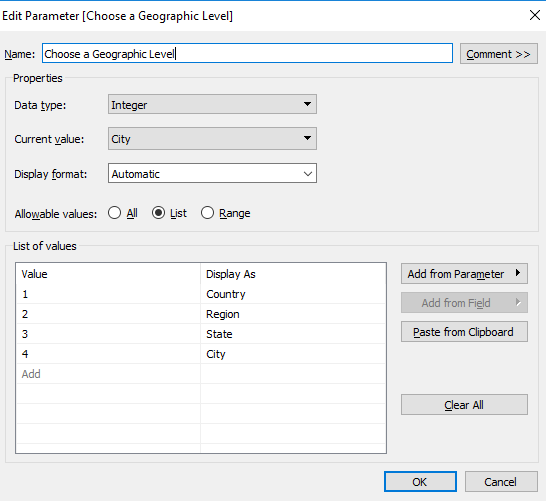
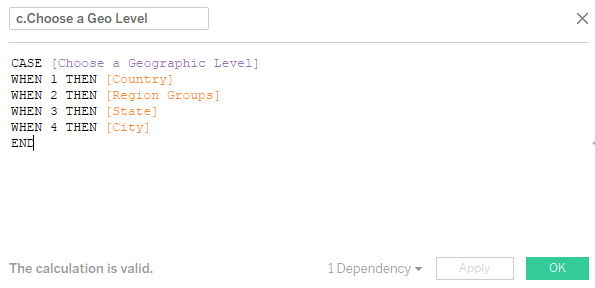
In this data, Managers from the People sheet line up with the Regions, so I created a geographic grouping of states following the given regions, then I placed this in my Country-State-City hierarchy. I then created a parameter very similar to the other integer parameters I had previously created, with different integers referencing different geographic levels. Of course, I tied this to actual dimensions through a calculated field. This was all to allow the user to easily switch between geographic levels without having to drag pills on or off of Detail in the Marks card:

Choose a Geo Level Calculation

I then brought my calculated field representing current sales measures to size and my % Change field to Color. The final step was to make sure the user could interact with all of these parameters, by right-clicking and selecting Show Parameter Control on all three of my parameters:

Final Tableau Viz

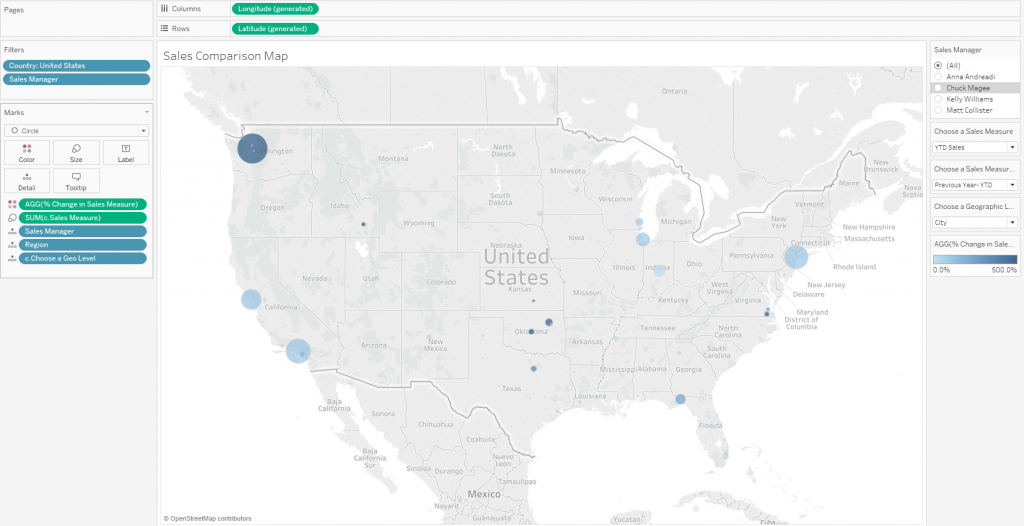
Some of the sales numbers for Global Superstore can get wonky and see quadruple-digit percent increases, so I capped the color scale at 500%. That way, the viewer can see that dark blue and hover over it to investigate further.

Calculations

Year-to-Date Sales

IF [Updated Order Date]<= TODAY()

AND DATEDIFF('year', [Updated Order Date], TODAY())=0

THEN [Sales]

END


Month-to-Date Sales

IF [Updated Order Date]<= TODAY()

AND DATEDIFF('month', [Updated Order Date], TODAY())=0

THEN [Sales]

END


Previous Year Sales

IF [Updated Order Date]<=TODAY()

AND DATEDIFF('year', [Updated Order Date], TODAY())=1

THEN [Sales]

END


Previous Year’s Month-to-Date Sales

IF DAY([Updated Order Date])<=DAY(TODAY())

AND DATEDIFF('month', [Updated Order Date], TODAY())=12

THEN [Sales]

END


Same Month, Previous Year Sales

IF [Updated Order Date]<= TODAY()

AND DATEDIFF('month', [Updated Order Date], TODAY())=12

THEN [Sales]

END


Previous Year’s Year-to-Date Sales

IF DATEPART('dayofyear', [Updated Order Date]) <= DATEPART('dayofyear', TODAY())

AND YEAR([Updated Order Date]) = YEAR(TODAY())-1

THEN [Sales]

END

Want More Questions from Tableau Training

  1. Questions from Tableau Training: Quick Filter Interaction
  2. Questions from Tableau Training: Labeling with Table Calculations
  3. Questions from Tableau Training: Speeding Up Presentation Views when Using Tableau
  4. Questions from Tableau Training: Dashboard Actions
  5. Questions from Tableau Training: Business Day Calculations
  6. Questions from Tableau Training: Adding Gaps Between Bars
  7. Questions from Tableau Training: When to Pivot Data in Tableau
  8. Questions from Tableau Training: Adding Conditional Formatting
  9. Questions from Tableau Training: Setting Weekday Start
  10. Questions from Tableau Training: How Do ZIP Codes Work in Tableau?
  11. Questions from Tableau Training: The Small Grey Bar Within a Quick Filter
  12. Questions from Tableau Training: Matching Mark Color
  13. Questions from Tableau Training: Showing the Null Indicator
  14. Questions from Tableau Training: Can I Manually Set the Colors of a Stepped Gradient?
  15. Questions from Tableau Training: How Can I Get Box Plot Data into a Crosstab?
  16. Questions from Tableau Training: How Do I Clear a Worksheet? Make a Copy?
  17. Questions from Tableau Training: Opening URL Actions Inside of a Dashboard
  18. Questions from Tableau Training: Can I Move Mark Labels?
  19. Questions from Tableau Training: How Can I Use My Current Report to Create a Viz?
  20. Questions from Tableau Training: Can I Create Text Hyperlinks on a Dashboard?
  21. Questions from Tableau Training: How Can I Transform My Crosstab into a Flat List?
  22. Questions from Tableau Training: Labeling the Top N
  23. Questions from Tableau Training: How Can I Customize Charts with Parameters?
  24. Questions from Tableau Training: Combining Measures into a Single Line
  25. Questions from Tableau Training: How Can I Create Custom Color Palettes?
  26. Questions from Tableau Training: Can a Top N Parameter be Nested Within Other Fields?
  27. Questions from Tableau Training: Conditional Scope on Tableau Calculations
  28. Questions from Tableau Training: Top Ten Plus N
  29. Questions from Tableau Training: Dynamic Label Positioning
  30. Questions from Tableau Training: Using Cross Joins to Solve Active Tickets
  31. Questions from Tableau Training: Top N Highlight Table
  32. Questions from Tableau Training: How to Use Specific Dimensions in Table Calculations
  33. Questions from Tableau Training: Moving Reference Line Labels
  34. Questions from Training: Comparing Metrics for Same Weekday in Previous Year
  35. Questions from Tableau Training: Colouring Specific Columns and Rows in a Crosstab
  36. Questions from Tableau Training: Creating a Custom Legend as a Sheet
  37. Questions from Tableau Training: How Can I Draw a 45-Degree Angle?
  38. Questions from Tableau Training: Down the Aggregation Rabbit Hole
  39. Questions from Tableau Training: Percent Change from Previous Period on a Map
  40. Questions from Tableau Training: Union File Names as Years
  41. Questions from Tableau Training: Conditional Coloring on Sparklines
  42. Questions from Tableau Training: Moving Column Headers to the Top of the View
  43. Questions from Tableau Training: Isolating Rank with Parameters and Calculations

More About the Author

Grant Eisenmenger

Analytics Consultant
Options for Row-Level Security in Tableau Now that you know you need Row-Level Security (RLS) and you are familiar with the basic concepts and building blocks, we can take a ...
Row-Level Security Basics in Tableau In this blog, we will run through fundamental concepts and building blocks for Row-Level Security (RLS) solutions. This will include: ...

See more from this author →

InterWorks uses cookies to allow us to better understand how the site is used. By continuing to use this site, you consent to this policy. Review Policy OK

×

Interworks GmbH
Ratinger Straße 9
40213 Düsseldorf
Germany
Geschäftsführer: Mel Stephenson

Kontaktaufnahme: markus@interworks.eu
Telefon: +49 (0)211 5408 5301

Amtsgericht Düsseldorf HRB 79752
UstldNr: DE 313 353 072

×

Love our blog? You should see our emails. Sign up for our newsletter!