Questions from Tableau Training: How Can I Transform My Crosstab into a Flat List?

Data

Questions from Tableau Training: How Can I Transform My Crosstab into a Flat List?

Our Certified Tableau Trainers are asked a myriad of questions each day. In this series, they share some answers.

Here’s a question I got from Quoc about how to work with the structure of the data source he was receiving:

“How can I transform my crosstab into a flat list?

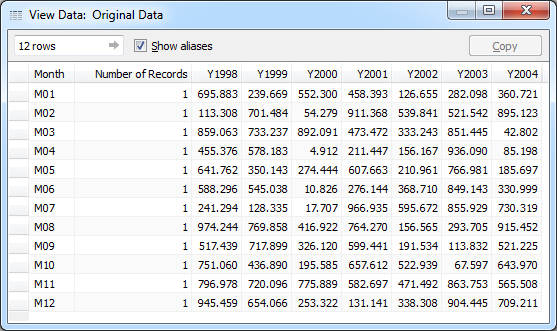
He wanted to take a table that looks like this:

View Data: Original Date

And make it into a flat list with a continuous date field. This is an unusual way to create a crosstab by dividing year and month, but we can make it work.

The Data

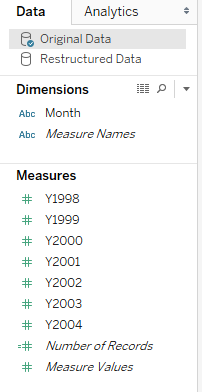
Notice within this style of data source that Year is divided into separate columns and months are divided into separate values for a Month field. When this table is imported into Tableau, the data pane will take each column year and make it into its own measure:

Tableau's Data pane

I’ll use an initial view to use Tableau to restructure my data. Then, I’ll be able to create a final view with a continuous date field.

View #1: Restructuring the Data

The first thing that I did was create a view in Tableau that allowed me to see my month matched up with each year, so I could put the data in chronological order. Since each year is a separate measure, I created a shared axis with each year listed using Measure Names and Measure Values:

Shared axis Tableau view

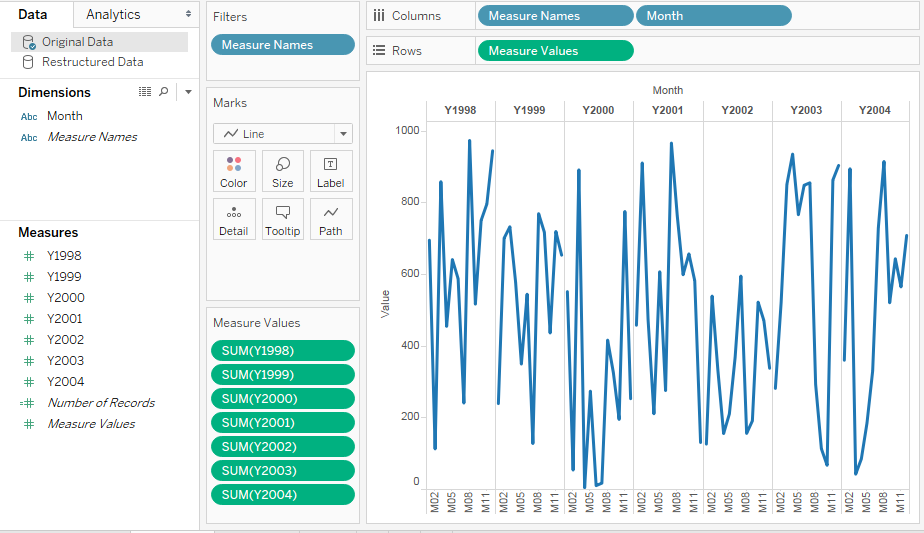
This puts the data in the correct order for a flat list, but it does not solve our problem. The dates are not continuous, which means that additional analyses like trend lines or forecasts are impossible with this view. Notice that there are discrete breaks in our line between each year. Each year is presented as a column header and not an axis.

I can use this view to copy the data (CTRL + C) now that it is in a better format:

Reformatted data

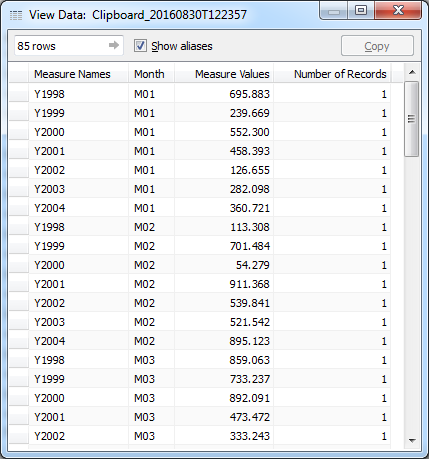
My data is out of the crosstab format.

Creating a Continuous Date

I can use the table above to combine the month dimension and all of the year measures into a single date field. First, I’ll name my years by changing Measure Names to Year. Next, I’ll create a calculated field to combine Years and Months into a single date field that is properly formatted. I’ll need to trim off the leading character, “Y” for Year and “M” for Month, as well as add a generic day to each.

Date calculation

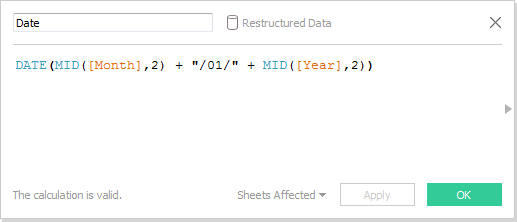
The calculated field above gives us the following format for our date: MM/DD/YYYY. I’ll also change our data type to Date.

We’re not out of the woods yet. Our date field won’t work, so we’ll use a Custom Date to fix the level of detail to Months and also make it continuous:

Tableau > Create Custom Date” src=”/wp-content/uploads/sites/default/files/blog-content/QFTTCrosstabsFlatList6.png” /></p>
<p>Now we are ready! Note, we could also create a discrete custom date field or set our level of detail to Months, Quarters or Years.</p>
<h2>Final View</h2>
<p>Now that we have a fully function date field in a list file, we can create views like the following:</p>
<p align=Final Tableau view with trend line

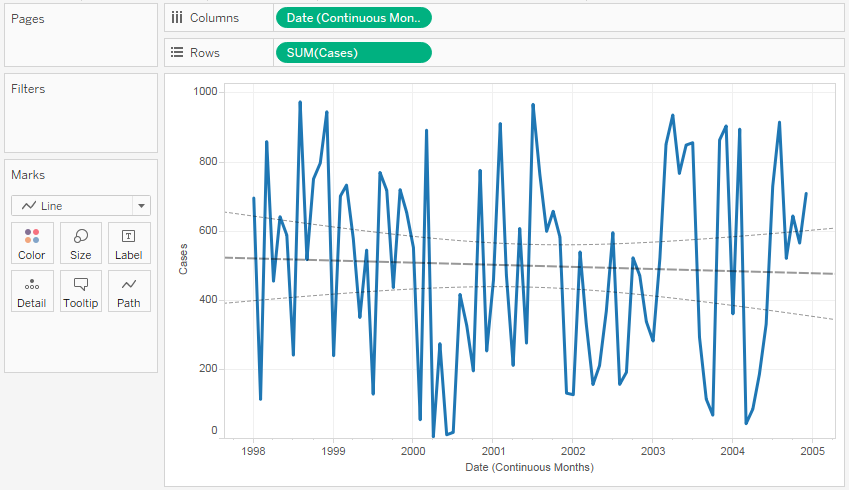
I’ve added a trend line and now we can see that the data presents a slightly downward trend.

Want More Questions from Tableau Training

  1. Questions from Tableau Training: Quick Filter Interaction
  2. Questions from Tableau Training: Labeling with Table Calculations
  3. Questions from Tableau Training: Speeding Up Presentation Views when Using Tableau
  4. Questions from Tableau Training: Dashboard Actions
  5. Questions from Tableau Training: Business Day Calculations
  6. Questions from Tableau Training: Adding Gaps Between Bars
  7. Questions from Tableau Training: When to Pivot Data in Tableau
  8. Questions from Tableau Training: Adding Conditional Formatting
  9. Questions from Tableau Training: Setting Weekday Start
  10. Questions from Tableau Training: How Do ZIP Codes Work in Tableau?
  11. Questions from Tableau Training: The Small Grey Bar Within a Quick Filter
  12. Questions from Tableau Training: Matching Mark Color
  13. Questions from Tableau Training: Showing the Null Indicator
  14. Questions from Tableau Training: Can I Manually Set the Colors of a Stepped Gradient?
  15. Questions from Tableau Training: How Can I Get Box Plot Data into a Crosstab?
  16. Questions from Tableau Training: How Do I Clear a Worksheet? Make a Copy?
  17. Questions from Tableau Training: Opening URL Actions Inside of a Dashboard
  18. Questions from Tableau Training: Can I Move Mark Labels?
  19. Questions from Tableau Training: How Can I Use My Current Report to Create a Viz?
  20. Questions from Tableau Training: Can I Create Text Hyperlinks on a Dashboard?
  21. Questions from Tableau Training: How Can I Transform My Crosstab into a Flat List?
  22. Questions from Tableau Training: Labeling the Top N
  23. Questions from Tableau Training: How Can I Customize Charts with Parameters?
  24. Questions from Tableau Training: Combining Measures into a Single Line
  25. Questions from Tableau Training: How Can I Create Custom Color Palettes?
  26. Questions from Tableau Training: Can a Top N Parameter be Nested Within Other Fields?
  27. Questions from Tableau Training: Conditional Scope on Tableau Calculations
  28. Questions from Tableau Training: Top Ten Plus N
  29. Questions from Tableau Training: Dynamic Label Positioning
  30. Questions from Tableau Training: Using Cross Joins to Solve Active Tickets
  31. Questions from Tableau Training: Top N Highlight Table
  32. Questions from Tableau Training: How to Use Specific Dimensions in Table Calculations
  33. Questions from Tableau Training: Moving Reference Line Labels
  34. Questions from Training: Comparing Metrics for Same Weekday in Previous Year
  35. Questions from Tableau Training: Colouring Specific Columns and Rows in a Crosstab
  36. Questions from Tableau Training: Creating a Custom Legend as a Sheet
  37. Questions from Tableau Training: How Can I Draw a 45-Degree Angle?
  38. Questions from Tableau Training: Down the Aggregation Rabbit Hole
  39. Questions from Tableau Training: Percent Change from Previous Period on a Map
  40. Questions from Tableau Training: Union File Names as Years
  41. Questions from Tableau Training: Conditional Coloring on Sparklines
  42. Questions from Tableau Training: Moving Column Headers to the Top of the View
  43. Questions from Tableau Training: Isolating Rank with Parameters and Calculations

More About the Author

Robert Curtis

Managing Director, APAC
Building Solutions with InterWorks at Corinium’s Data Architecture Conference in Melbourne InterWorks was a proud sponsor of the Data Architecture Conference hosted by Corinium in Melbourne on 21 and 22 June 2023. Hundreds of ...
Virtual Event Recap: Deep Dive of Tableau Parameters For our June Lunch and Learn, we did a deep dive on parameters for our friends across Australia and Singapore. Tableau is the premier ...

See more from this author →

InterWorks uses cookies to allow us to better understand how the site is used. By continuing to use this site, you consent to this policy. Review Policy OK

×

Interworks GmbH
Ratinger Straße 9
40213 Düsseldorf
Germany
Geschäftsführer: Mel Stephenson

Kontaktaufnahme: markus@interworks.eu
Telefon: +49 (0)211 5408 5301

Amtsgericht Düsseldorf HRB 79752
UstldNr: DE 313 353 072

×

Love our blog? You should see our emails. Sign up for our newsletter!