Our Certified Tableau Trainers are asked a myriad of questions each day. In this series, they share some answers.
Here’s a question I got from Quoc about how to work with the structure of the data source he was receiving:
“How can I transform my crosstab into a flat list?“
He wanted to take a table that looks like this:
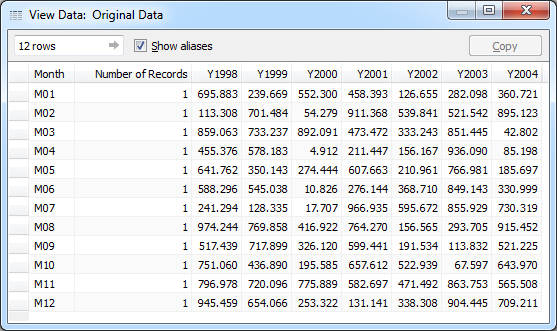
And make it into a flat list with a continuous date field. This is an unusual way to create a crosstab by dividing year and month, but we can make it work.
The Data
Notice within this style of data source that Year is divided into separate columns and months are divided into separate values for a Month field. When this table is imported into Tableau, the data pane will take each column year and make it into its own measure:
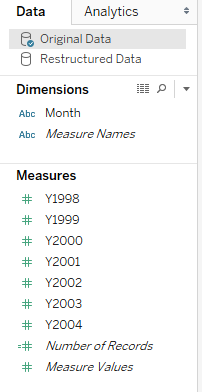
I’ll use an initial view to use Tableau to restructure my data. Then, I’ll be able to create a final view with a continuous date field.
View #1: Restructuring the Data
The first thing that I did was create a view in Tableau that allowed me to see my month matched up with each year, so I could put the data in chronological order. Since each year is a separate measure, I created a shared axis with each year listed using Measure Names and Measure Values:
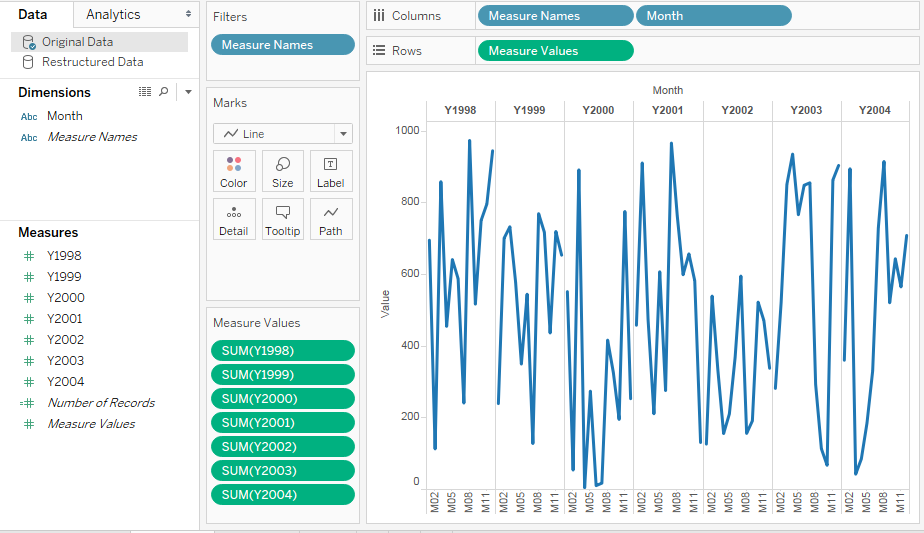
This puts the data in the correct order for a flat list, but it does not solve our problem. The dates are not continuous, which means that additional analyses like trend lines or forecasts are impossible with this view. Notice that there are discrete breaks in our line between each year. Each year is presented as a column header and not an axis.
I can use this view to copy the data (CTRL + C) now that it is in a better format:
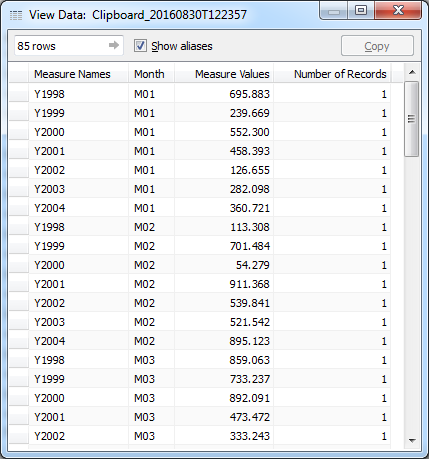
My data is out of the crosstab format.
Creating a Continuous Date
I can use the table above to combine the month dimension and all of the year measures into a single date field. First, I’ll name my years by changing Measure Names to Year. Next, I’ll create a calculated field to combine Years and Months into a single date field that is properly formatted. I’ll need to trim off the leading character, “Y” for Year and “M” for Month, as well as add a generic day to each.
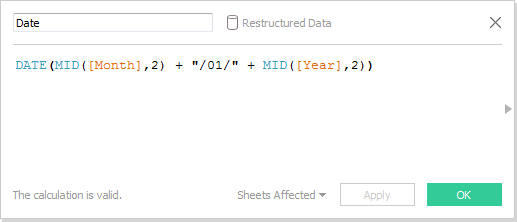
The calculated field above gives us the following format for our date: MM/DD/YYYY. I’ll also change our data type to Date.
We’re not out of the woods yet. Our date field won’t work, so we’ll use a Custom Date to fix the level of detail to Months and also make it continuous:
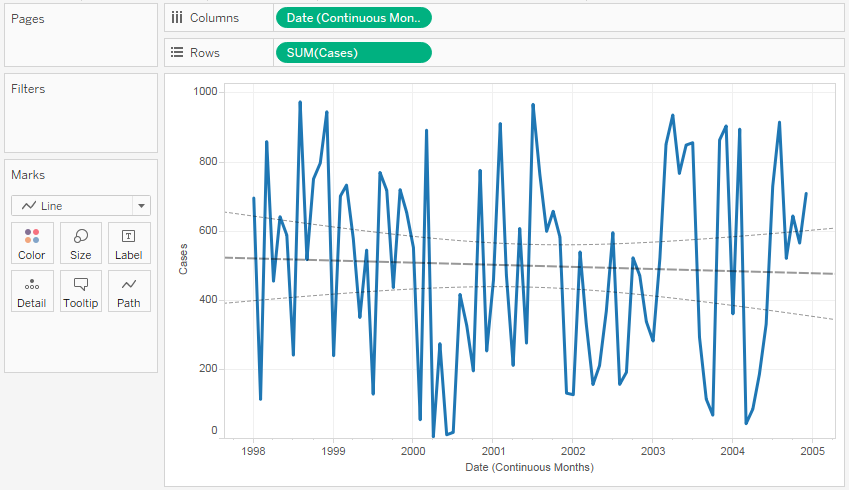
I’ve added a trend line and now we can see that the data presents a slightly downward trend.

