
Tableau Deep Dives are a loose collection of mini-series designed to give you an in-depth look into various features of Tableau Software.
This is the third article in our Tableau Deep Dive on level of detail. Part 1 reviewed the idea of detail. Part 2 introduced level of detail calculations and examined the Include LOD calculation. Let’s now jump into Exclude.
A Use Case
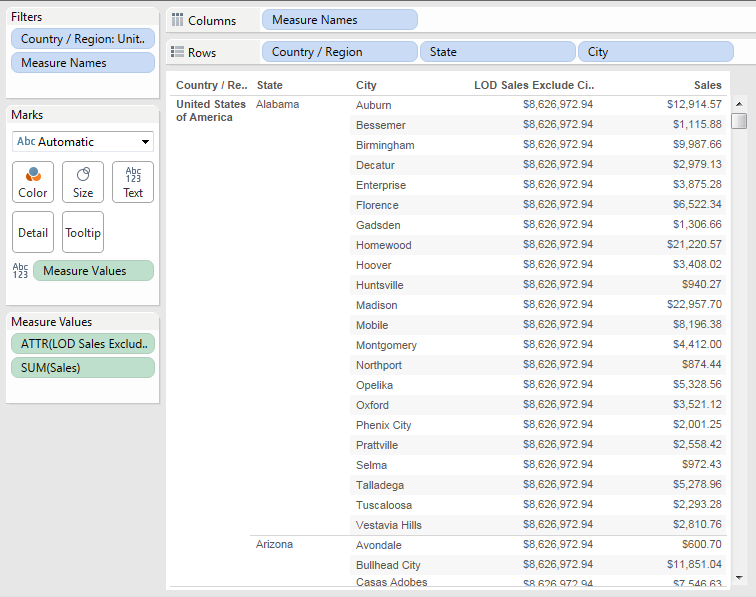
For our examples in this article, we’ll use the Superstore Sales Training sample data source that you can find in either the Tableau Fundamentals or Tableau Advanced classes. Let’s build the following view:
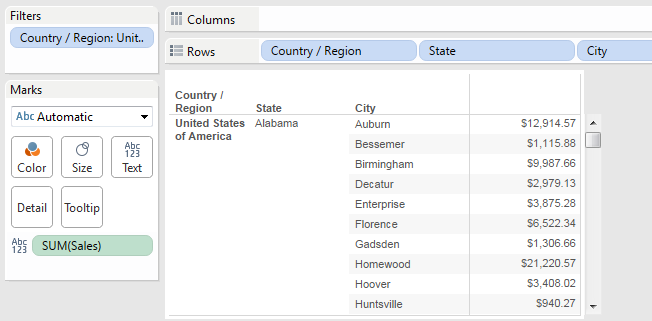
We’re looking at the sum of sales by City further segmented by State and Country/Region with a USA-only filter. If I wanted to show my sales by state or country alongside sales by city, it would prove to be particularly difficult. Even re-ordering my dimensions has little effect aside from how the viz is organized.
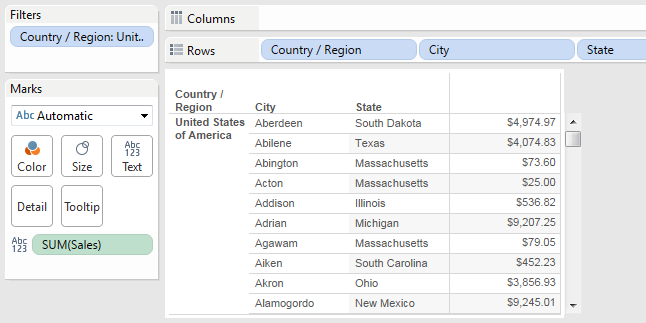
Regardless, the Sales column has the exact same values as our previous view:
The only way we could accomplish this is by creating Totals for each pane, which would then sum the state at the bottom.
Exclude LOD Calculation
We can use the Exclude level of detail calculation to accomplish this requirement. Let’s start by excluding the City dimension. Remember our example with the Include LOD calculation? We must first sum our results within the calculation and then allow Tableau Desktop to use the average aggregation type in the view. Here’s our calculation, named LOD Sales Exclude City:
{EXCLUDE [City]: SUM([Sales])}
By using this calculation, we are essentially removing City from our view for the purpose of our LOD calculation to determine a value based on the State’s level of detail. In other words, this calculation is mimicking this type of view:
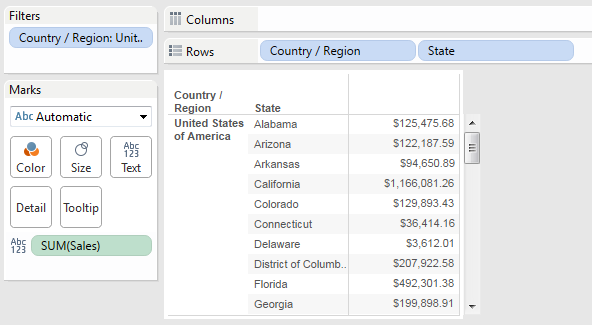
We can use the above viz to validate our LOD calculation to make sure its returning the value that we are expecting. Let’s add our LOD calculation to our initial view with the Country/Region, State and City dimensions using the average aggregation type.

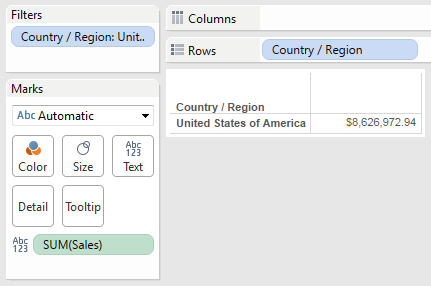
Eureka! We can see that our LOD calculation is returning the correct sum on the State level. Let’s take this to another level … literally. We’re going to use our Exclude LOD calculation to not only exclude City but also State to get the sum of the Country/Region dimension. As a guide, here’s the equivalent view for what our calculation is going to produce:
And here’s our calculation to exclude both City and State from our original view:
{EXCLUDE [City], [State]: SUM([Sales])}
By excluding City and State, our LOD calculation gives us the following result:
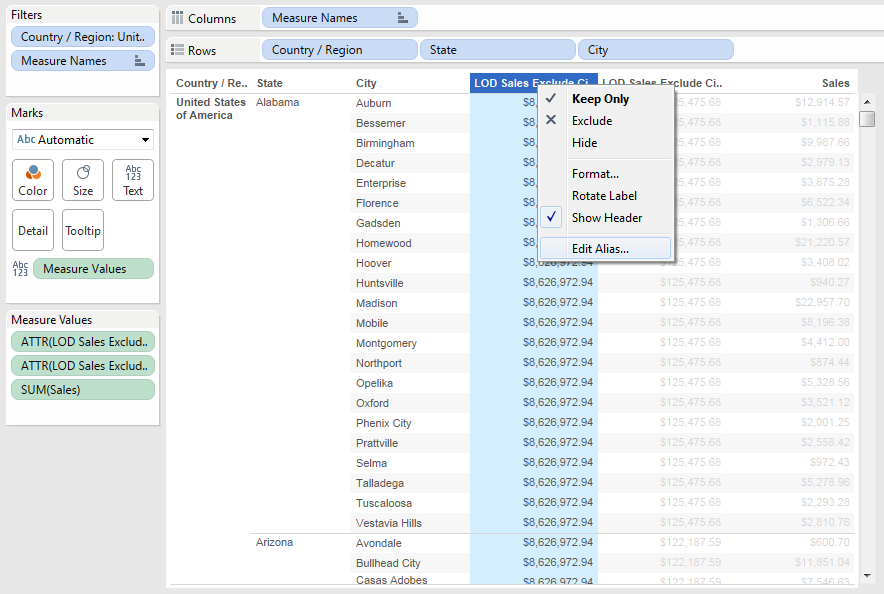
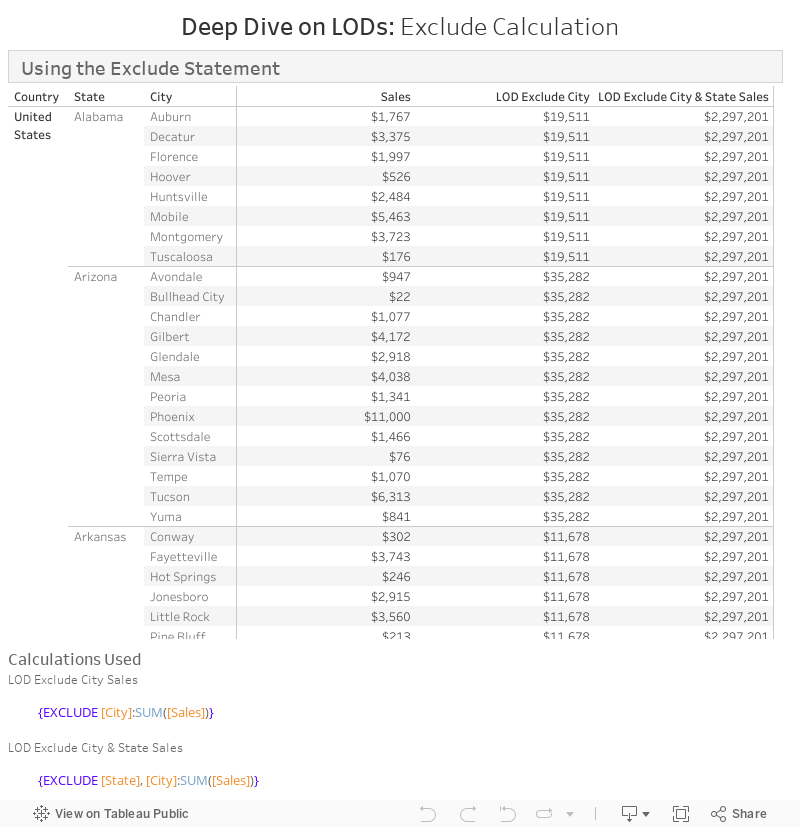
To conclude, let’s add both of our LOD calculations to our views – one excluding just City and the other excluding both City and State. We can also edit the Column header alias by right-clicking on the name:
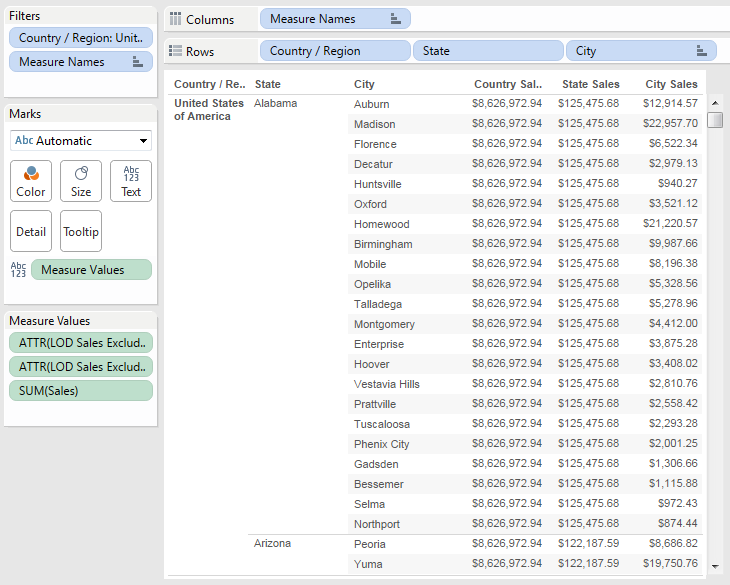
We’ll rename them Country Sales, State Sales, and City Sales respectively. Here’s our final view with both of our LOD calculations:
Missing Dimensions?
You might be wondering what will happen if I exclude a field in my LOD calculation that isn’t in the view? The simple answer is nothing will change in your view. This is because you are telling Tableau to remove a dimension that does not exist, so it will return the same result as if you never used the Exclude LOD calculation in the first place. Both Include and Exclude return results relative to your visualization, which means it matters what dimensions you have included in your view due to how each of these LOD calculations function.
To illustrate this point, let’s take our view from above and remove the Country/Region, State and City dimensions from the Rows shelf and replace it with the Department dimension. We’ll leave the Sales measure along with our two LOD calculations that exclude City as well as City and State.
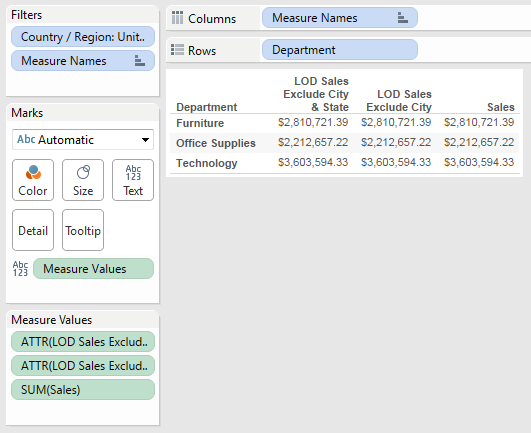
Tableau is performing the calculation exactly as intended; but since none of the excluded dimensions are in the view, it returns the exact same value as sum of Sales outside of the LOD calculation.
In the next article of the LOD Tableau Deep Dive, we’ll examine an LOD calculation that is not relative to the view you’ve created. This is the Fixed calculation. As always, we appreciate any thoughts or feedback in the Comments section below!