
Tableau Deep Dives are a loose collection of mini-series designed to give you an in-depth look into various features of Tableau Software.
In parts one through five of this Deep Dive on Dashboard Design, we’ve built a dashboard step-by-step that focused on planning, structure, proof of concept, interactivity and visual design. It might be tempting to end the Deep Dive series there as a finished project. The real world dictates otherwise, because we have yet to cover one of the most important aspects of a dashboard:
Performance.
This is a critical component for two reasons. First, a slow loading dashboard reduces the effectiveness of your reporting tool. Second, a poorly designed dashboard can have performance ramifications across all of Tableau Server. A slow loading visualization can negatively impact a number of components in Tableau Server.
We’ll tackle this issue of performance by exploring a basic governance process. To ensure that every dashboard is as optimized and efficient as possible, each dashboard must be prepped for deployment into the PROD environment.
Concepts
Like our previous articles, we are going to spend some time introducing important concepts on this topic and then apply them to our online marketing dashboard.
What is Governance?
Governance in data analytics covers a broad range of protocols and technologies, from data to dashboard. We’ll discuss a formalized process, ensuring any dashboard that hits the production environment is thoroughly vetted against a checklist of essential best practices and safety controls.
Let’s define a sample production checklist as part of a governance strategy. We’ll use the check list below in this article, and the next article on publishing, to conclude our dashboard project.
- Validate the Build
- Clock Performance
- Document Workbook and Data
- Apply Brand standards
- Tag for Deployment
Numbers one through four will be addressed in the practicum section below. Steps five and six will carry over to the last article in this Deep Dive.
Load Time Goals
Let’s establish some thresholds for our performance metrics. What is slow loading? What should our goal be? Without this threshold, our capacity to set reasonable expectations for our dashboard’s performance is limited. Some dashboards are slower than others for reasons out of our control and the end users should be made aware of that.
Part of our focus throughout this article is how fast web pages will load across different devices. Slow loading pages saw higher rates of abandonment, which means a potential lead or sale just walked out the door. We can use these web metrics as a “user frustration index.” This doesn’t mean that your users will abandon your dashboard, but they’ll likely perceive your dashboard as being slow which will increasingly affect adoption.
I’m going to focus on user abandonment on mobile devices, because there is a greater degree of patience needed for slower loading items than there would be for computers on broadband networks. It’s a closer corollary to a dashboard in terms of user expectations.
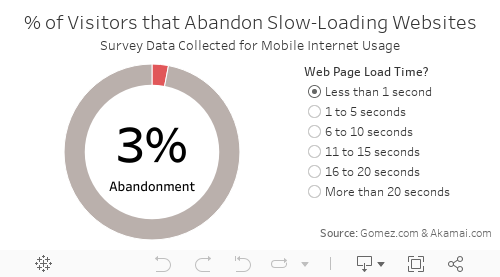
Above: Embed dashboard
We can see in the data above, anything beyond 10 to 15 seconds is going to cause some frustration with our user base.
Common Tableau Bottlenecks
One of the most common questions I get as an analytics consultant and trainer is, “Why is my dashboard slow?” The answer most often refers back to the data. If your data is slow, then your dashboard will be slow. Tableau can only be as fast as the data that is powering the visualization.
That doesn’t mean that we can’t make improvements. There is a lot we can do with our data to make it faster. The easiest solution is to create an aggregated extract with only the fields needed to power that particular dashboard.
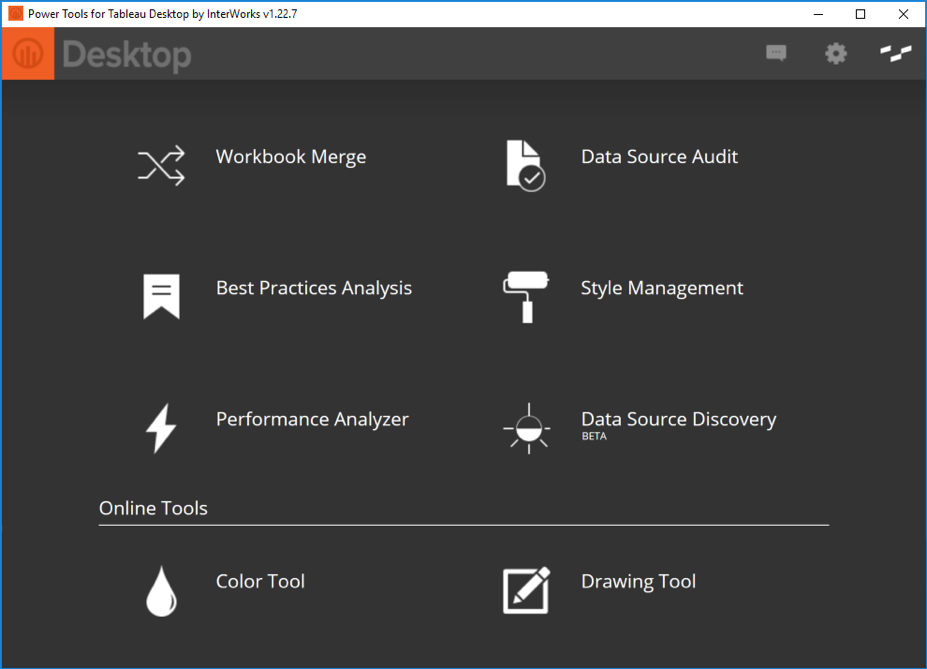
There are various other common mistakes made during the creation of the dashboard that can cause performance issues. We’ve outlined a lot of these in our Tableau Performance Checklist above. All those tips are included in the Best Practices Analysis tool in the Power Tools for Tableau: Desktop suite of applications, which we’ll use below in the Practicum.
Practicum
Let’s apply a governance process to improve the performance of our dashboard by using the tools in Power Tools for Tableau Desktop designed to help pinpoint performance optimization. The important thing to remember is that this process is repetitious. For most dashboards, you should identify issues that should be fixed. After correcting those items, you’ll restart the governance cycle and continue until you can check each stage with success before continuing towards deployment.
#1 – Validate the Build
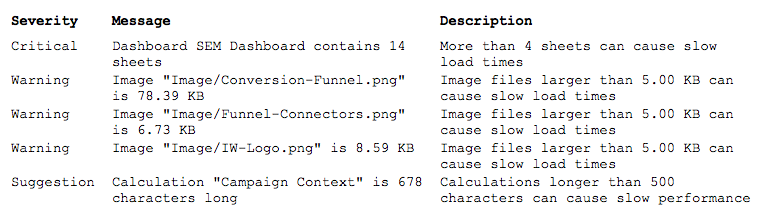
The first step of a governance process is to assess how it was built by using the Best Practices Analysis tool. When I analyze my online marketing dashboard, I get the following warnings:
NOTE: Each of these best practices is tied to detailed blog content that can be found here.
Remember, these are best practices which give us general guidelines to help make our dashboards better.
For instance, the Best Practices Analysis tool identified 14 worksheets on my dashboard. Most of those are actually aggregated totals (11 of the 14 sheets). I’m okay with proceeding without correcting that critical warning, as my dashboard is not tasked with a lot of rendering or calculations across all of my different visualizations.
The other suggestions are ones that I will take to heart:
- My images (funnel, connecting lines and InterWorks logo) could be easily optimized for a significantly smaller size. A tool like Photoshop is perfect for these tasks. First, let’s see the actual size of these images on my dashboard using the Layout tab. Most often, you will resize your images to fit into a specific space. Sizing them exactly for that space will cut down the file size.
- Next, I can tinker with the image type to reduce the size. As a rule of thumb, a png file is best for transparent backgrounds, gifs are great for solid colors and jpgs are best for photos and natural gradients. Without significant loss in their appearance, I reduced my total image size down by 71% (26.4 KB).
- The Campaign Context calculation is a very long string calculation that uses several contain functions. These are often the slowest types of calculations because of the nature of string fields. The calculation does not add a lot of value to my view as it only appears in a tooltip, so I’m going to remove it.
My dashboard now complies with best practice recommendations, with one exception. Let’s see how it performs in actual time.
#2 – Clock the Performance
The next tool I’ll use is the Performance Analyzer. This tool is similar to the Performance Recording feature in Tableau Desktop, except that it analyzes performance in real-time rather than creating a performance session. The Performance Analyzer is particularly useful to pinpoint specific aspects of my dashboard that are slowing it down, including data queries.
Here are my results from the TWBX dashboard output from the tool:
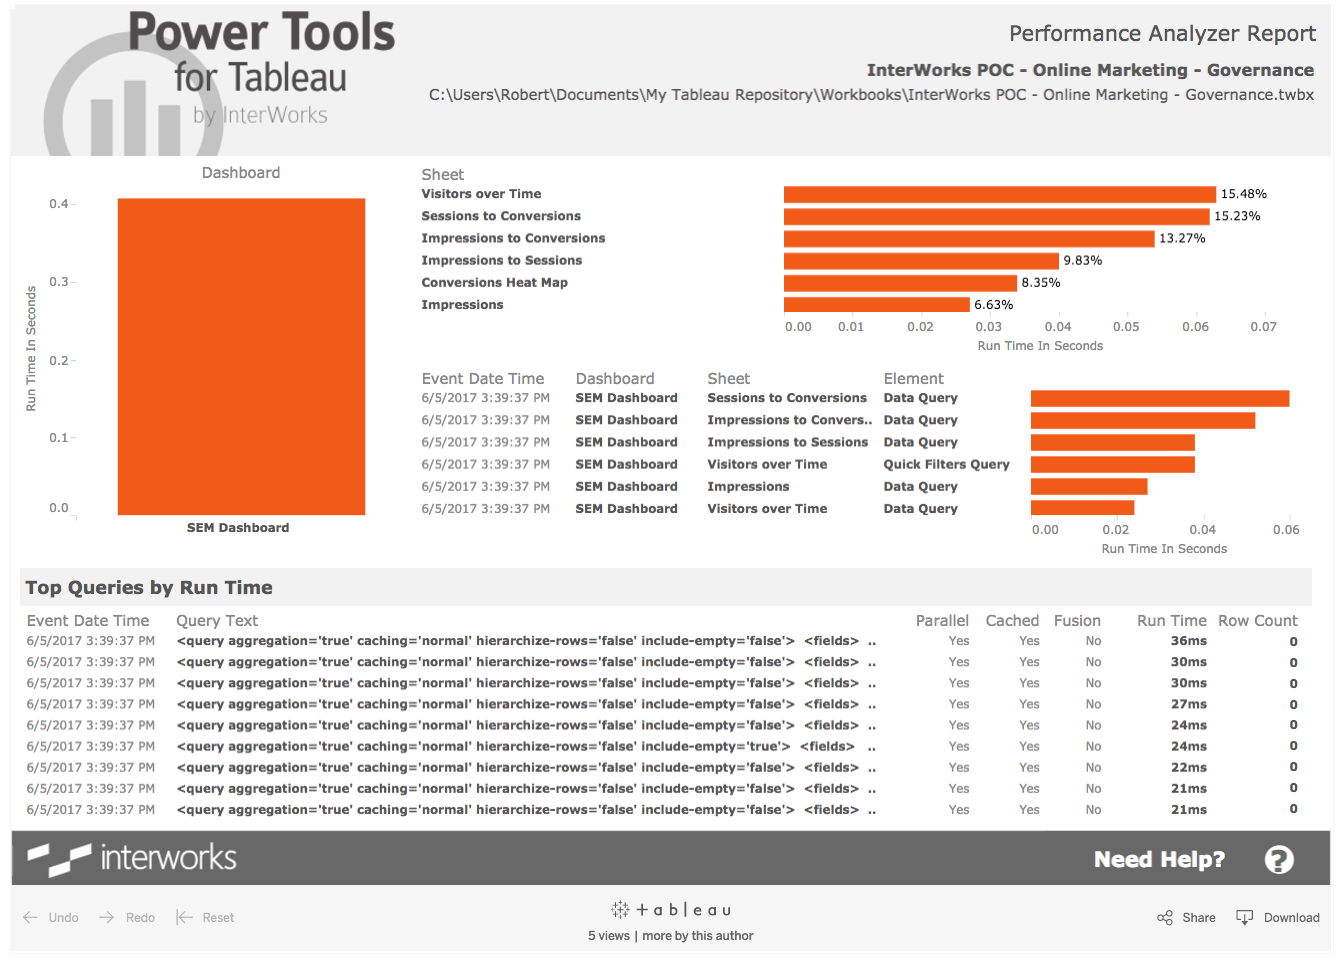
Above: Embed DB
My overall load time is 0.4 seconds for the entire dashboard. That’s well within my acceptable threshold. If I did have a problem, the detail within this dashboard would help me find it.
Let’s add another consideration here. My data, as a result of being drawn from Google Analytics (and Google Adwords indirectly), is already heavily aggregated in a Tableau friendly format. If my data was from a combination of different data sources, in a very granular format or with a lot of unused columns, an extract would likely be a saving grace for performance.
You can find more information about this on Data Extracts for Tableau.
#3 – Documentation
My dashboard is optimized and ready to deploy onto PROD. Now, I need to document what’s in my workbook down to the data sources, the SQL queries, the formulas of the calculated fields and more. I can do that with the Data Source Audit tool. It’ll give me three different outputs from the audit: a pdf, a TWBX and an Excel file. I could use the Excel as a data source for my own analysis. Here is the Data Source Audit pdf: /wp-content/uploads/sites/default/files/Online_Marketing_DB%20%281%29.pdf
And here is the TWBX:
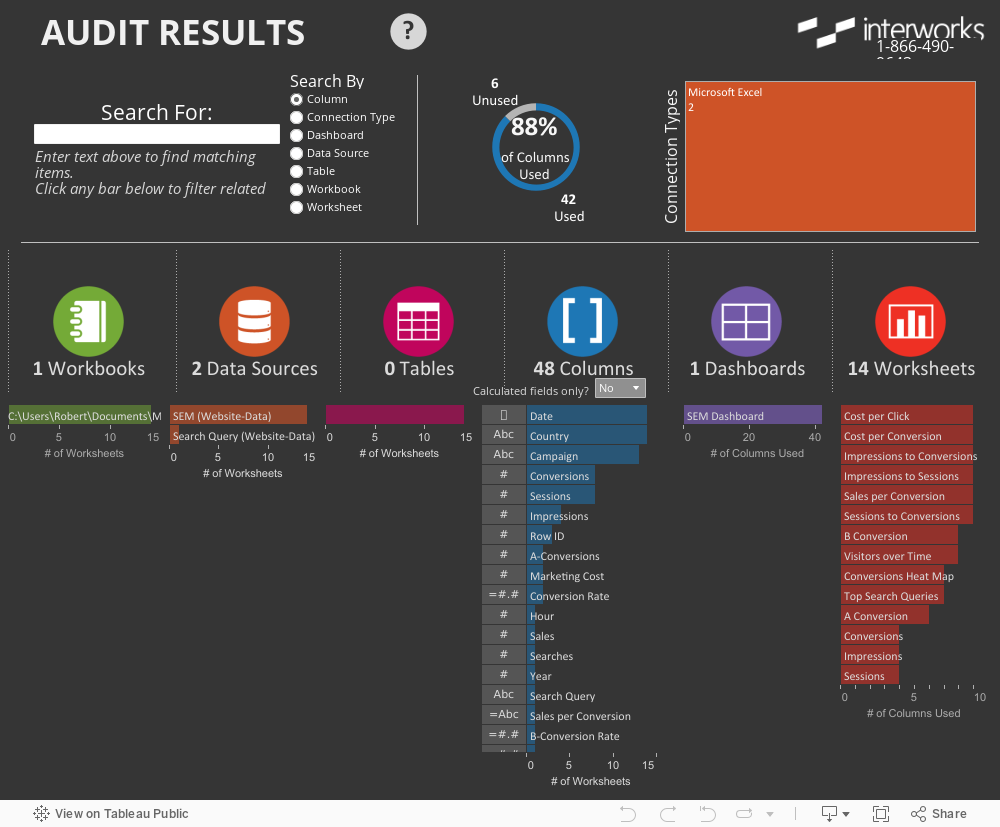
Above: Embed DB
I’m ready to tell my Tableau project admin that my dashboard is ready for the next step in deployment, steps four and five.
What’s Next?
Our final article will explain how to deploy our finished dashboard and data sources into production. We’ll explore both Tableau Public and a Tableau Server scenario. Until then, please leave any thoughts or questions in the comment section below. Cheers!