
Our Certified Tableau Trainers are asked a myriad of questions each day. In this series, they share some answers.
This is one of the many questions I get asked as a Tableau Trainer. It may seem straight forward enough, but it isn’t!
“Is there a way to work out how many active customers we have at any given time?”
Prepping the Data
Most clients have data that is time series based. They know when each interaction was made and by whom. Using this, they can pull the first interaction and the most recent interaction from an individual. So far, so simple! If they want to see the number of customers at every point in time, trying to plot this data without additional manipulation can become quite difficult. Even with rather small data sets, this would involve table calculations over a very large number of data points. Also, it would force Tableau to render between several hundred thousand points to several hundred million. Please do not do this!
In this example, I used the Global Superstore data set, familiar to many Tableau users, and added a few years to the dates. Any time a customer had a transaction later than 20/08/2017 (Day/Month/Year format for UK folks), I removed that date and made it NULL. You can substitute an exact date and use TODAY() to always base it on the current date. This data will now be used as a number of active tickets and projects. I then exported only the ID, Start and End dates.
Data Manipulation
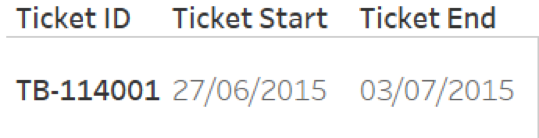
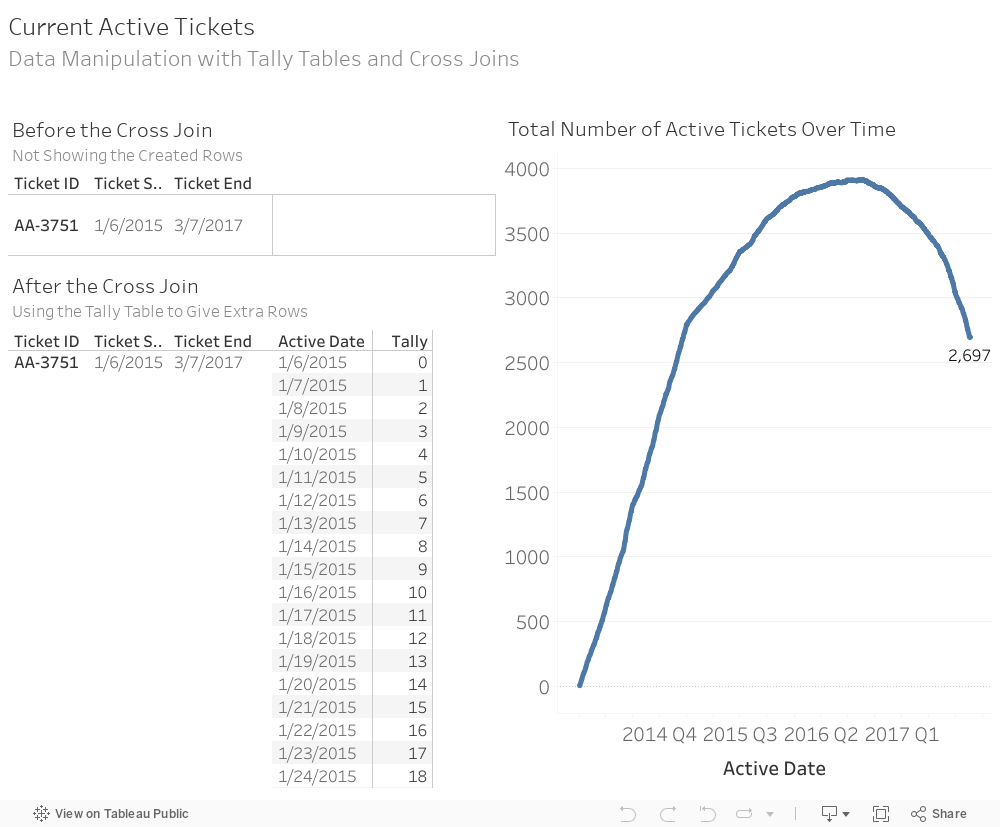
Even with this data set, we still don’t have an easy way to plot the passive time between the first and last interaction. This is where we get to do data manipulation! We’ll use a data manipulation technique to get a single row of data for each ticket and for every day that exists. So instead of seeing this:
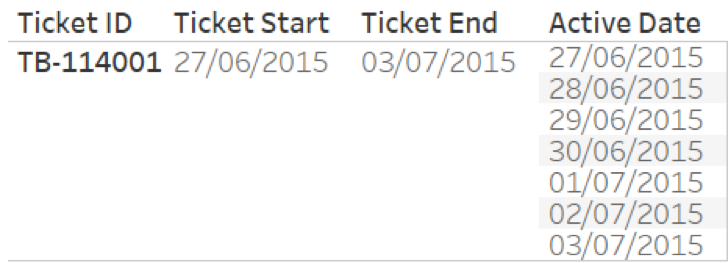
We should see:
To do this, we need a way to duplicate the rows and then make calculations that will incrementally increase the date. First, let’s duplicate the rows. To do this, I used a technique called a cartesian product. This is the cross join of two tables, which simply means every row from the first table is joined to every row from the second table. Cross joins aren’t one of the default options available in the data source window in Tableau. Thanks to custom join calculations, we can now create them with ease.
Before the cross join, I’ll show the second table as a tally table. This is another common technique. Most DBAs will have used a tally table at some point. A tally table is just a table with one column and values from zero to 10,000 or more. In my case, my short tally table is 2000 entries long. I know this is enough as I need at least one row per day, and I know that none of my tickets were open for more than 2000 days.
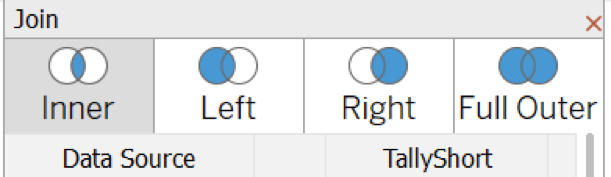
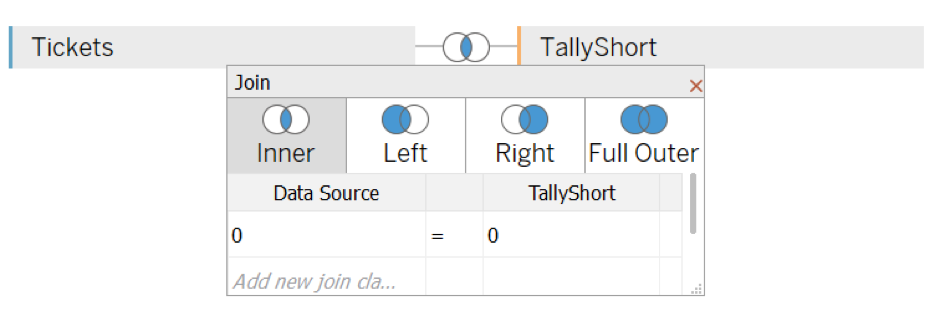
When we try to join, we see that the cross join I’ve referred to is not available!
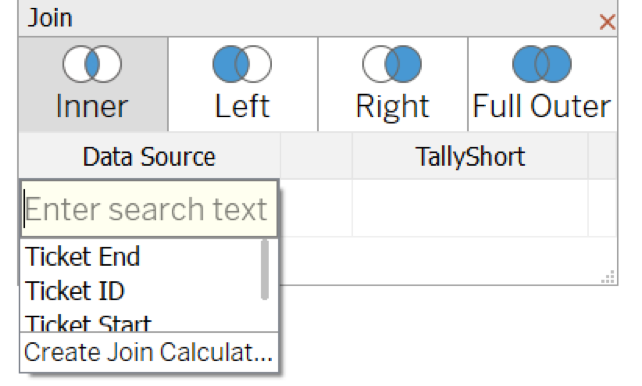
But we can use custom join calculations to create a key to join on. Select the Create Join Calculation and there is a formula entry. I’m going to use zero on both sides since zero is an integer and integers are the most efficient data type to join on. By using zero, you can visualise a new column in both data sets. This column has zero in every row. Because cross join is not a native feature, we have to trick Tableau into performing one. Now that there’s a zero in every row in both tables, each row in the first table will match to every other row in the second table.
This is my result with both tables joined together:
The joining is complete! Every row from the tickets data source is duplicated 2000 times and an extra column called tally goes from 0-2000 has been added. Now, we will do a bit of clean up before making the visualisation. The next goal is to create two fields, one of which will be the new date we graph on and the second will remove excess rows as we want to work with as few rows as we possibly can. We will have a few excess rows as not all tickets had a length of 2000 days.
I will create a field called Active Date.
DATE(DATEADD('day',[Tally],[Ticket Start]))
Let’s summarise what we have done so far:
- Every single row of my data is duplicated 2000 times
- There’s a column that goes from 0 to 2000 called tally.
- I have a date field that goes from each ticket start date to every start date +2000 days.
Last Step
The final step of data manipulation is to create a field called Dates InRange
[Active Date] <= IFNULL([Ticket End],#20/08/2017#)
None of the tickets were 2000 days old. Some are only one day, but several are 1000 or more days old. As mentioned above, we want to remove the excess dates. Although we have these 2000 rows of data per ticket, we only need one row of data per ticket and per day it was active. I’ll compare every single Ticket ID row to that ticket’s end date.
Some of the tickets are still currently open. If they are open they will not have a ticket end date. In the data they will be null. There is an IFNULL() calculation which will take those null values and replace them with an arbitrary date. I’m using an absolute reference for the day I created this calculation, but you can also use TODAY().
This calculation returns a Boolean. My Active Date, which is a field we previously created, will be less than or equal to the Ticket End Date or #20/08/2017# (TODAY()).
This field is then applied as a data source filter, as I want any further calculations and visualisations to completely ignore these dates in the future.
Building the Visualisation
All there is left to do is create the visualization. We already have one row per ticket for each day it was active. We simply drag the Active Date onto the Columns shelf to give an x axis for our time interval and then drag the Number of Records field onto the Rows shelf. Each data point on this line graph will tell us how many active tickets I had at that point in time. You can see the chart and viz I built below.
Now, go get some coffee, roll up your sleeves and try it on your own!