
Often, clients want to show a geographic area of their coverage for some services. This might be countries per region or sales rep, or it might be countries where the product can be sold, etc. Now in Tableau, you can imagine that you would have a field like Country to plot on a map. However, in many cases, we do not have a country to plot. We instead have regions.
Why a Mapping Table Won’t Quite Work
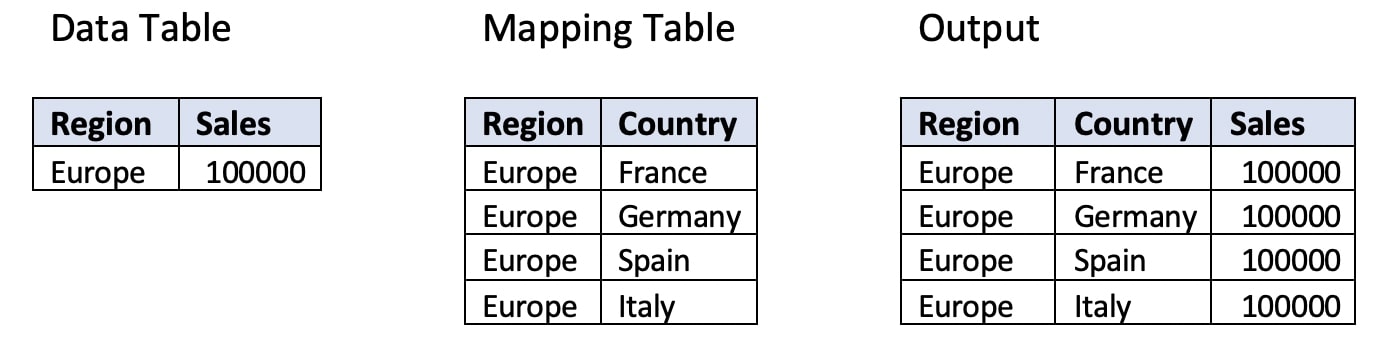
Now, you could take those regions and create a mapping table, and the mapping table would have one column for each region and one column for the countries within the regions. Then you’d join that together and voila! You could plot the countries on the map. This works perfectly fine!
That is, it works perfectly fine until … say, you also wanted to see the value of those regions. If we joined, we would duplicate our data for each region, once for every country within that region. In the below table, we can see how this join would cause duplication on our Sales for Europe:
Note: You can solve this with level of detail calculations, but this is part of a larger discussion of how relationships can be utilised to avoid the need for LODs to solve every little data and calculation issue.
Instead of using a join, you can now utilise a relationship. The relationship will allow you to plot the countries in the view and only show the value one time without duplicating that regional sales. In this example, we will assume you have a list of regions with values, and you’ve created a mapping table so that each country is mapped to a single region.
STEP 1.
Create the relationship. Using your regional data and your mapping table, drag these into the view data source view:
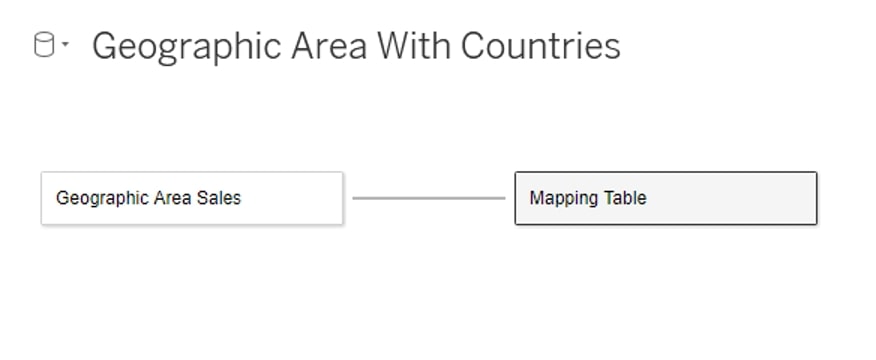
You don’t want to see any Venn diagrams here. If you do, that’s a join! You will need Tableau 2020.2 or newer to use a relationship.
STEP 2.
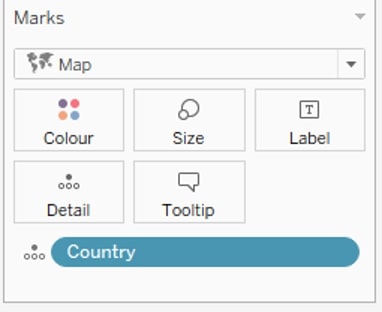
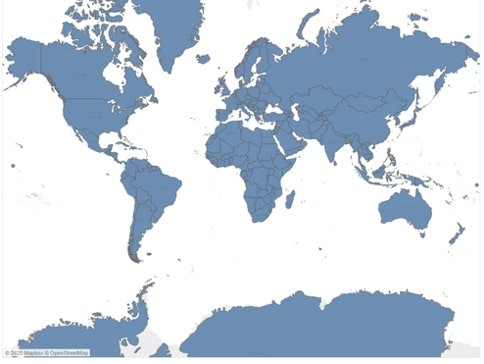
Get a new sheet and put Country onto the Detail shelf of your Marks card, and change your marks type to Map. Every country you had in your dataset should now fill in. For my dataset, I’ve provided a list of all the countries:
STEP 3.
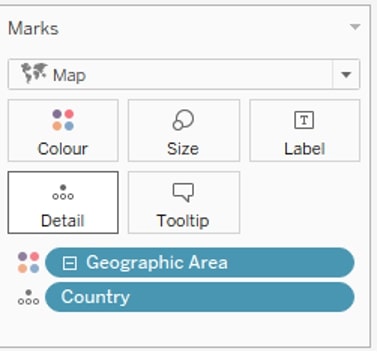
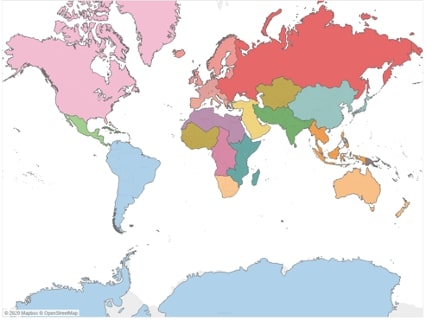
Use the Geographic Area field from your real dataset, and drag it to Colour on your Marks card:
STEP 4.
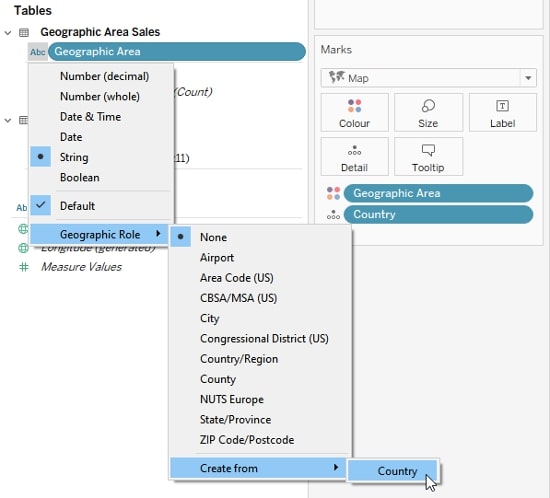
On the Data pane, go to Geographic Area and click the Abc. This is Tableau telling you that it’s a String. Go down to Geographic Role and change it from None. You will go down to the Create from option and select Country. This will assign the country geographic role to the country fields within each Geographic Area, and it will automatically create a hierarchy for your Geographic Area and your Country fields:
STEP 5.
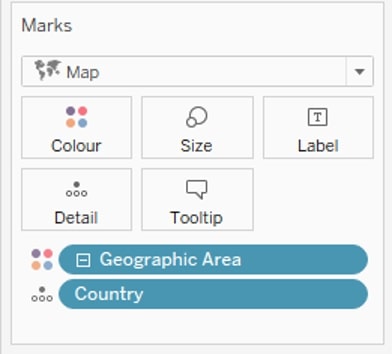
Now, you will notice the symbol next to Geographic Area. It’s a hierarchy. Go ahead and click it to collapse the hierarchy from the Country level to the Geographic Area level:
STEP 6.
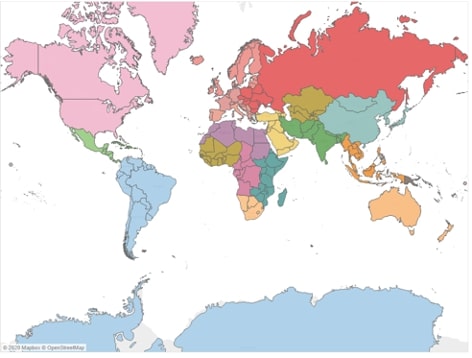
Your final result will be the same regions but without the country borders:
Mapping Made Simpler
You can also interact with the visualisation on my Tableau Public profile. Follow the link for more interactivity, and remember that we at InterWorks are always ready to support you, no matter your data challenges. Reach out if we can help!