
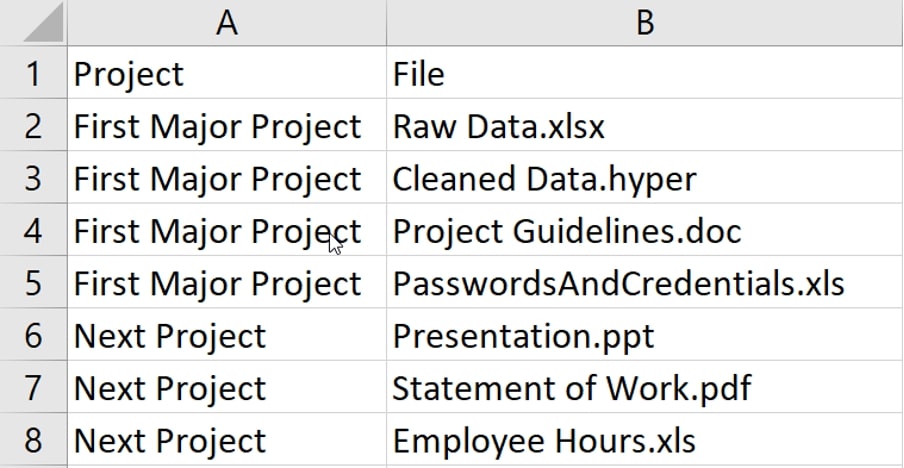
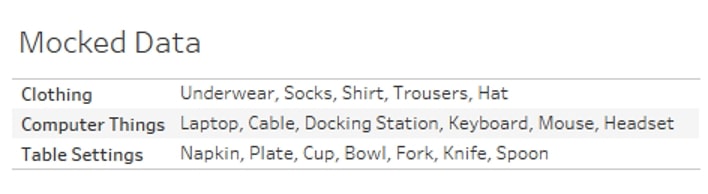
Recently, one of my colleagues had an interesting issue with a client’s request. The client they were working with was getting a file in a specific structure from their source system. This file was, of course, only available as an Excel export. For simplicity’s sake, there were only two columns: Project and File. The Project column shows what project the columns were assigned to. File simply shows the files within each project. Close your eyes and imagine that. Did it look something like this?
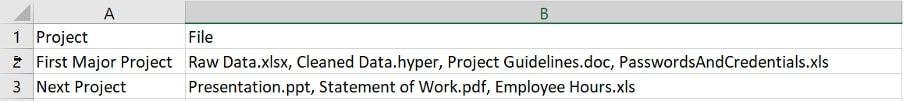
It probably did because that is how we typically think of data structures. But instead of one row per file and project combination, there was one row per project. All the file names were delimited within a single row:
This is a rather basic example. They had hundreds of projects and sometimes dozens or more files within each project. And instead of trying to memorise the contents of those fake tables, we will use a cleaner, easier-to-digest set of images provided by InterWorks Experience Designer David Duncan:

Above: Original structure
Above: Desired structure
The client is wanting to show each file name in Tableau on a separate row and be able to apply filters and other calculations—something we cannot do in the existing structure and can only do if the data structure is altered.
This can be solved using a variety of ETL tools quite simply. They use words like split to rows, split and pivot, etc. If you have an ETL solution, I recommend using that tool instead of doing it inside Tableau Desktop. However, our limitation was that the client was only allowed to use Tableau Desktop; they had no access to ETL and no ability to alter how the file would be sent to them.
We want to take the original structure and get it into the desired structure, like the images above.
Step One: Create the Scaffolding Table
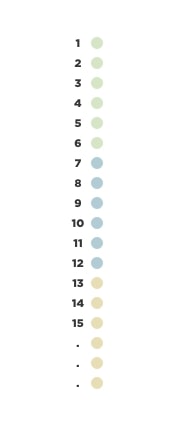
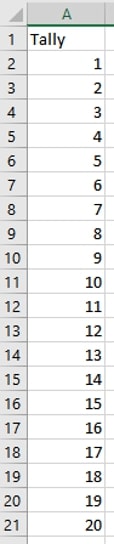
For our scaffolding table, I am going to use one of my favourite data-wrangling tools, a tally table! A tally table is simply a data table that goes from 1 (sometimes 0) to any number. In our example, we only need a few rows. Often, these can be pretty much any length from dozens to tens of thousands:
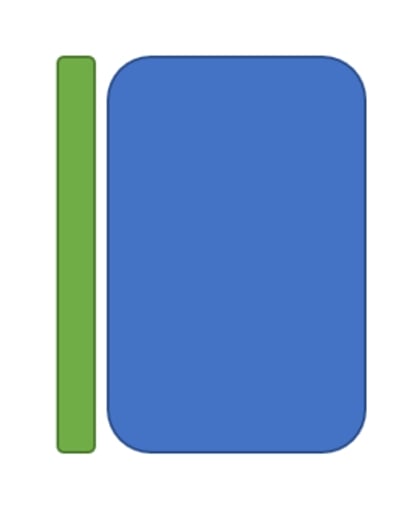
Let’s also take a look at the mocked-up dataset we will use for this exercise:
The blue table is our mocked data, and the green is the tally table. We have not done any joins yet. We are just looking at the data:

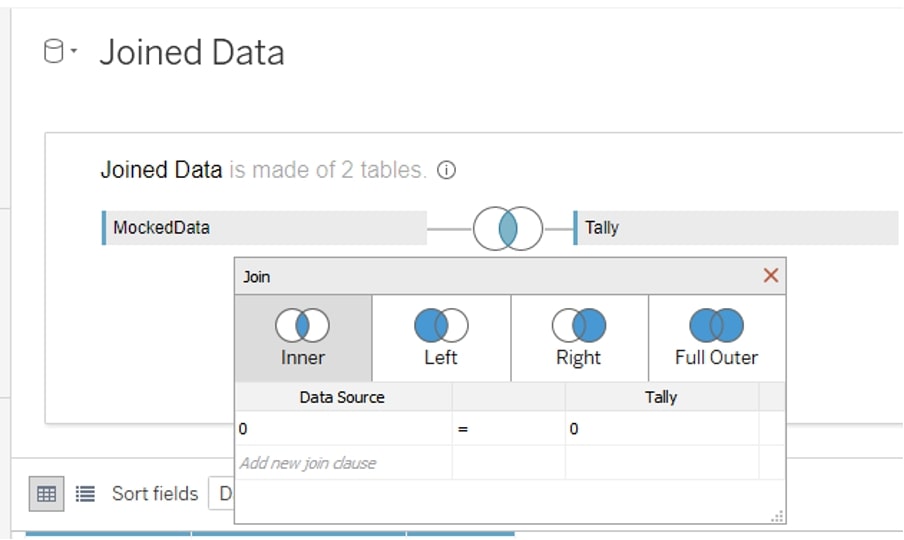
Step Two: Join the Data
Now, we want to join the data. We want every row in the blue table (mocked data) to be repeated for every row in the green table. We’d usually use a cross join for this, but Tableau does not support those natively. So instead, we will mimic this. We will mimic it by using an inner join and making a join condition that is identical. In our example, I’ll make my join calculation 0 (zero) on both sides:
After the join, it would look something like this:
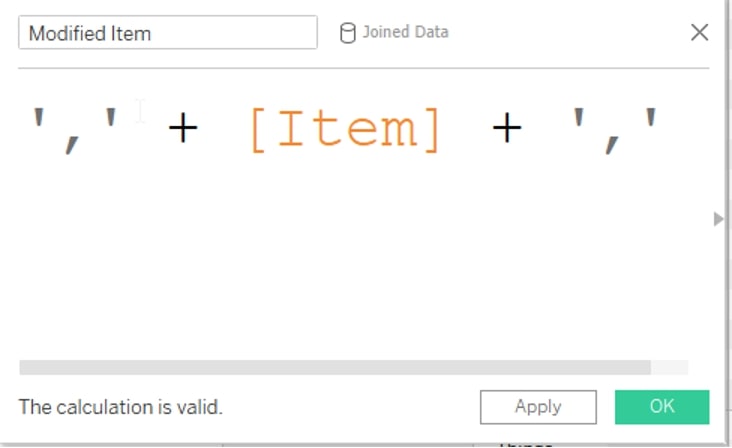
Step Three: A Delimiter in Our Calc
Okay. We’ve scaffolded the data. Now, we need to do a minor calculation to make future calculations a bit easier. We are going to add the delimiter (for us, a comma) to the very front and back of the string. We’ll call this field Modified Item:
Now, that structure looks something like this:

Step Four: Identify Elements
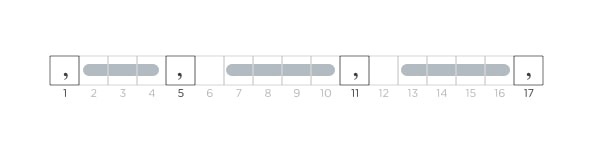
Now, we are going to start identifying what the first, second, third, etc., element of each of our categories is. To do that, we need to find where our commas are. We will do this because we know one of our elements is between each comma. What we need is a way to identify where the commas are. Mentally, I want you thinking about some sort of character counter like this:
In order to get this, we will use the formula FINDNTH( ):
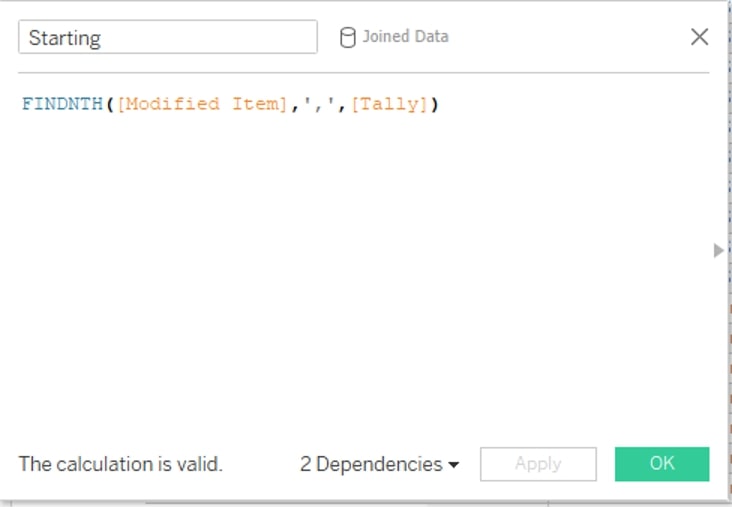
What the above will do is identify where the comma is for every tally. So, Tally 1 will tell us where the first comma is, and Tally 2 will tell you where the second comma is and so forth.
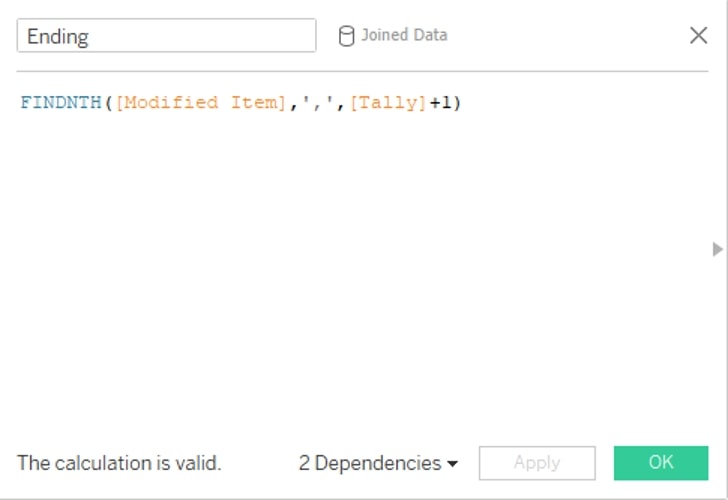
If we use another very similar calculation at the same time, we can also identify where the ending comma is for each element. This is because on Tally 1, we know where the first comma is and the second comma. On Tally 2, we’d know where the second comma is and the third:
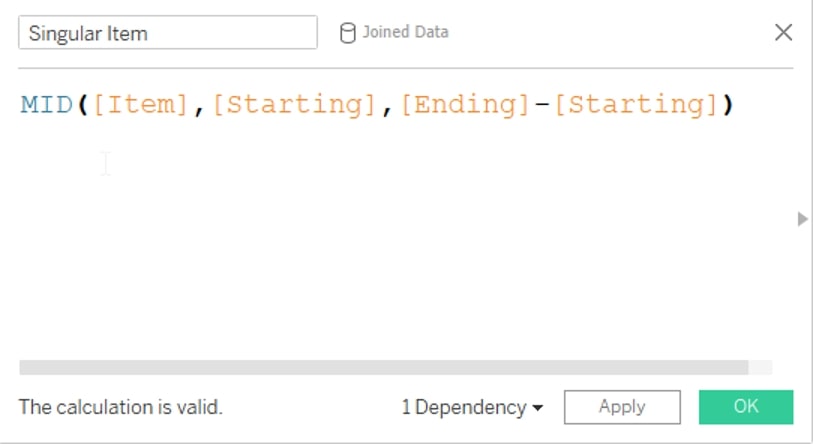
Step Five: Use the MID( ) Function
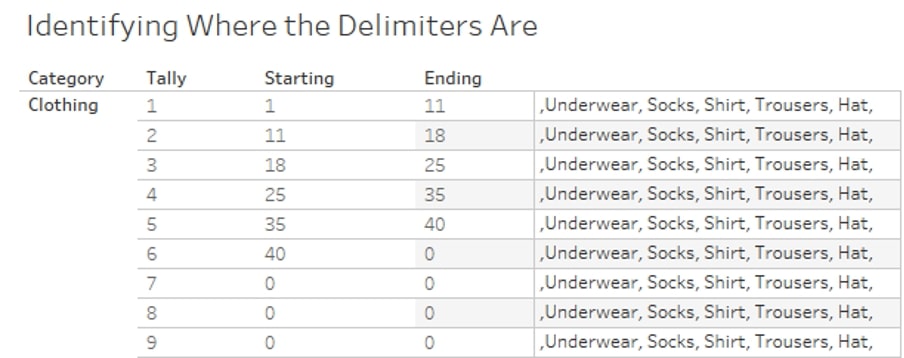
Now, for each rally (that is, for each Category and Tally) combination, we want the characters between each starting and ending. So, for Tally 1 – Clothing, we want characters 2-10, for Tally 3 – Clothing, we want characters 19-24.
What we know is that we start at the Starting character, and we use a length that’s the Ending minus the Starting. Tableau has a great formula that helps with this. It’s the MID() function. The MID function needs a start and a length:
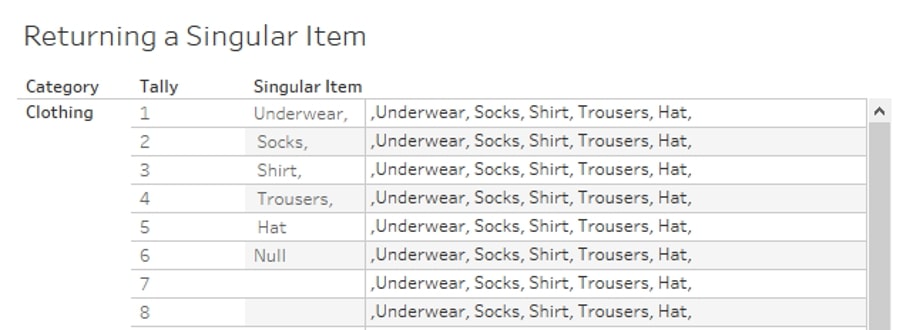
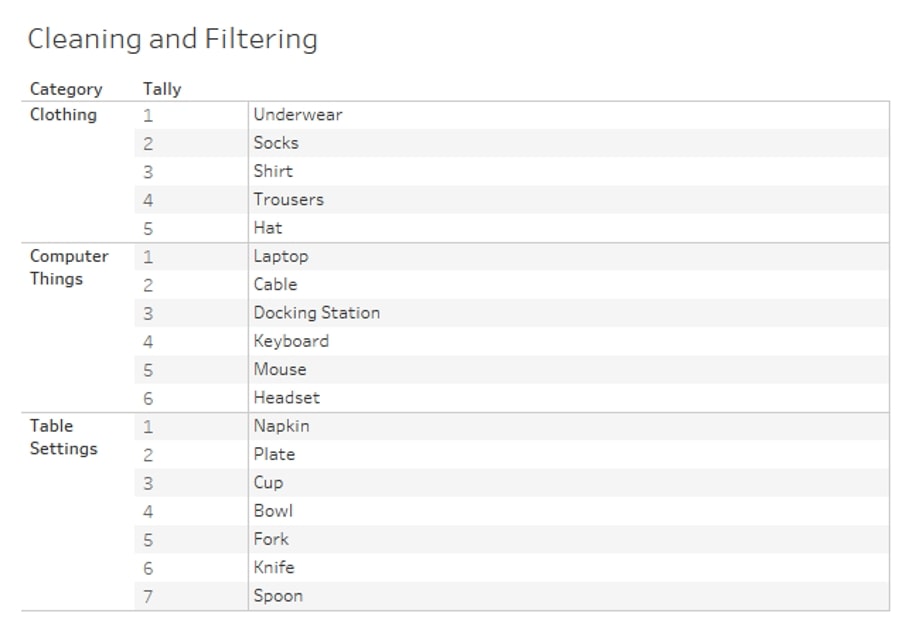
Step Six: Clean and Filter Data
Almost there! You’ve done all the hard work. You will likely have noticed that our Singular Item field has a few leading spaces and extra commas we don’t want in our view. You likely also noticed that we have too many Tally rows for our categories as none of our categories needed 20 distinct items. In this step, we will clean and filter.
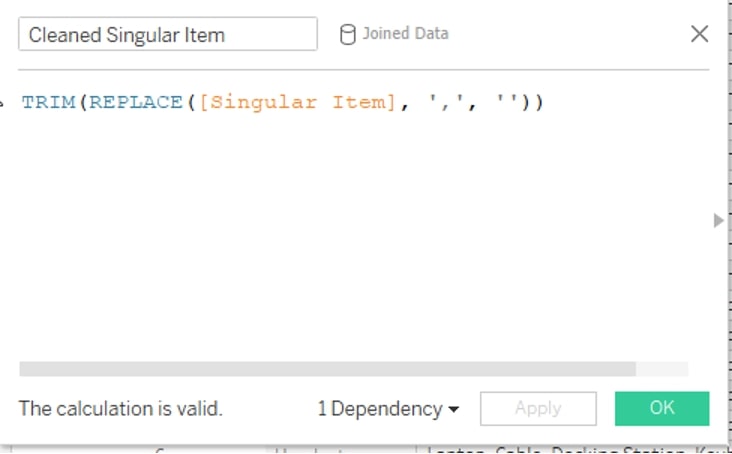
In order to clean, we are going to wrap our existing function to REPLACE( ) all the commas ( , ) with nothing ( ‘ ’ ), and second, we will wrap a TRIM( ) function to remove all the trailing and/or leading spaces:
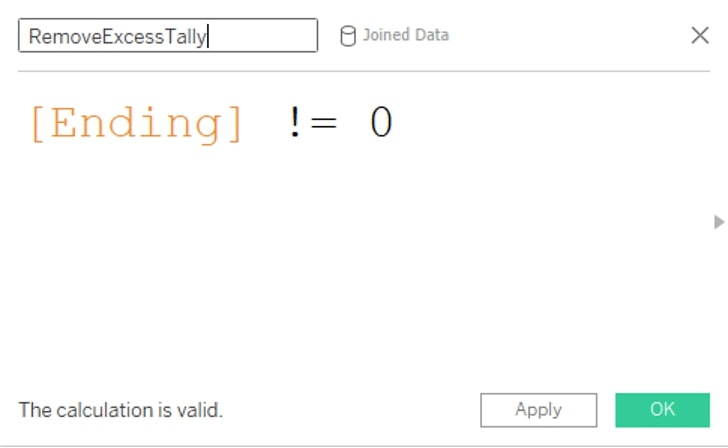
To filter, we can use the field Ending and just make sure that it is not equal to 0 (zero). When this returns 0, it means there is no ending comma. If there’s no ending comma, there is no element to grab:
I’ll stress once again that you can and should do this in an ETL tool, if possible. But if not, Tableau Desktop and your good friend Tally Tables can still help. In this example, we’ve utilised a join to make the magic happen, but if you have Tableau 2020.2 or later, you can make use of the relationship model for the same outcome as well.
To go through the process yourself, feel free to download the Excel file and Tableau workbook below. For a look at the steps broken down in a Tableau dashboard, explore the viz here.