The Tableau Performance Checklist series is designed to help you streamline your dashboard performance and Tableau Server configuration. Each post expands upon one item listed in the master Tableau Performance Checklist. As of 2024, you can find an updated Tableau Dashboard Performance Checklist here.
The next item in our Filtering checklist is:
“Avoid high-cardinality quick filters (multi-select or drop-down lists). High-cardinality quick filters are slow to load and render.”
Let’s jump right in and see how high cardinality in your quick filters can negatively impact performance.
What is Cardinality?
In SQL, the cardinality of a set is the number of unique values in a particular column. For instance, the cardinality of the states in the United States is fifty because there are fifty unique values regardless of how many rows there are in that column. Cardinality is normally classified into three categories:
- High-cardinality: These columns have values that have very rare values or are unique. An example of high-cardinality column values might be unique identifiers or email addresses.
- Normal-cardinality: The normal category has values that are somewhat uncommon. An example might be customer last names. There are some names that are common, such as “Jones,” but there would be values that are very uncommon, such as “Jahanshahi.”
- Low-cardinality: These refer to column values that have very few unique values. Some examples would include Boolean values or major classifications such as gender.
Naturally, when you have a quick filter appearing in your visualization, the cardinality of the set will determine how many filter options will appear in the filter.
The Problem
The problem with high-cardinality quick filters is, of course, that Tableau must query and return all of the values in the quick filter if you use a drop-down list. If you have a lot of values in the quick filter to choose from, then it incrementally adds to the things that Tableau must do before your visualization can finish loading.
If you use the Best Practice Analyzer tool from our Workbook Tools for Tableau, it will return high-cardinality quick filters as a flag. In addition, it will even return the number of unique values in the high-cardinality column as an extra piece of information.
A Wild Solution
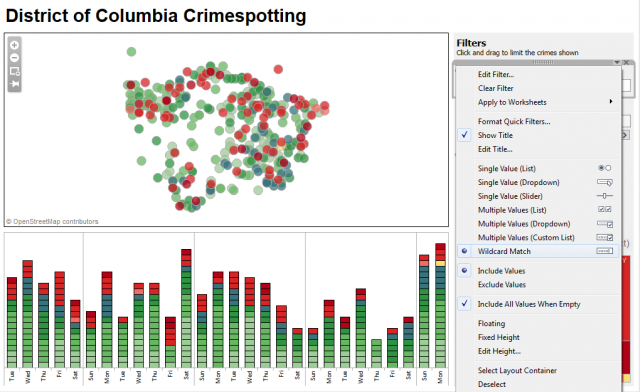
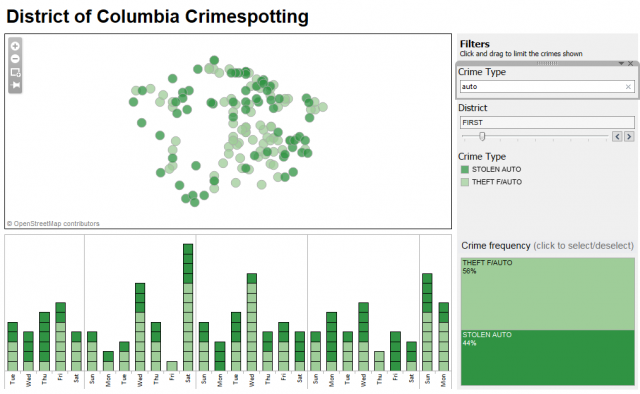
The best way to fix this potential problem is to remove the drop-down option from the quick filter. Instead, consider using a Wildcard option instead. This allows the report user to begin entering characters, and Tableau will provide a list of matches that they can select. This reduces the upfront processing time to get the visualization functioning. When you start looking for a filter value, Tableau will not have to load the full scope of unique values in the quick filter.

Changing the quick filter type is quite easy. Just click on the down arrow on the dashboard and select Wildcard Match. Then, when you enter in a few characters, Tableau will return all values that match those characters.

Mastering Best Practices
If you’re interested in becoming a Tableau Server guru, then learning these performance best practices is essential. Check back frequently as we add new posts and dive deeper into each point in the Tableau Performance Checklist.
Another great way to identify best practices is to leverage the insights offered by our Performance Analyzer, part of Workbook Tools for Tableau. It will examine all of your workbooks, worksheets, dashboards and data sources against a list of best practices to ensure that you’re using all the tips and tricks to guarantee your visualizations are moving at light speed.
As always, feel free to get in touch with us if you have any questions regarding performance or anything Tableau related! We’d be happy to help.


