
The Tableau Performance Checklist series is designed to help you streamline your dashboard performance and Tableau Server configuration. Each post expands upon one item listed in the master Tableau Performance Checklist. As of 2024, you can find an updated Tableau Dashboard Performance Checklist here.
Speed counts, people! Today’s report consumers expect their dashboards to run as fast as a web page. Now that high speed internet is the standard in business, that’s a lot to compete with. This is why it is essential to optimize each and every dashboard for the absolute best performance.
The next item in our Filtering section is:
“Avoid selecting ‘Only relevant values’ for your quick filters. This requires sequential queries. Do not use this when not needed.”
Let’s dig into what this means and why it can have a negative impact on your dashboard’s performance.
The Optional Setting
As Julie Andrews says in “The Sound of Music:”
“Let’s start at the very beginning, it’s a very good place to start.”
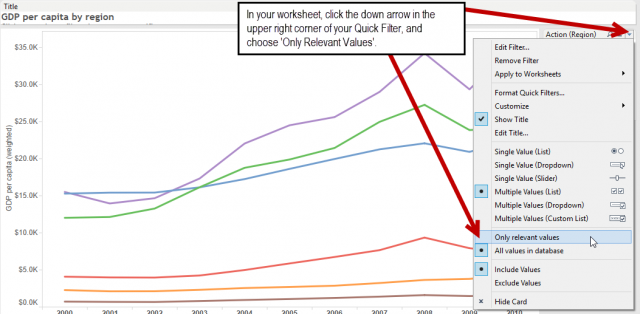
You’re welcome for the ear worm. What in the world does the Only relevant values option even mean? The default option for a quick filter is All values in database, which is pretty much exactly like it sounds: the quick filter will make all values in the database for that particular field available for user selection.
Contrast that with Only relevant values. This option first compares the values it returns from the database with those in other quick filters. Then, it only shows the values that apply given the choice made on other filters. It can be found on the menu for the filter right here:
A good example for this would be a dashboard that displays information on the United States. Let’s say there’s a regional filter and a state level filter. By selecting Only relevant values for the State filter, it would first look at the Region the user selects. If the regional filter is set to the Western region, then the state-level filter will only show states from the Western region. The user is therefore prevented from making an invalid combination of filter selections. SCORE! You slay me, Tableau.
Just to drive the point home, if Only relevant values is not selected for the State filter, then it would produce a blank view if the Western region is selected. Any state outside of the Western region is the selected.
Performance Limitations
I hate to be the bearer of some potentially bad news, but I have to wave the caution flag here. The problem with this setting arises when there are more than two quick filters. Tableau is forced to run not just one query to pull all values for each quick filter, but it has to run a second sub-query in order to populate the view on each selection based on relevancy with other filters on the dashboard. As a result of these sub-queries, the performance of your dashboard can suffer (bringing out my inner drama queen here) dramatically.
This limitation goes hand-in-hand with a previous Tableau Performance Checklist item, “Limit the Number of Quick Filters.” In general, the more quick filters you add to your dashboard, whether they include relevant values only or not, the more opportunities there are to ruin your report’s performance.
You can use our Best Practice Analyzer tool (part of the Workbook Tools suite) to flag workbooks with this potential problem.
A Better Solution
So, how do we get around quick filter performance issues with relevancy? The same way we did with normal quick filters: Use a dashboard action filter whenever you can! An action filter does not require a separate query or sub-query to produce the results.
Not only will this improve the performance of your dashboard, it will create a cleaner and more intuitive interface for your report consumer. You can accomplish this by selecting any view in your dashboard and selecting Use as Filter.
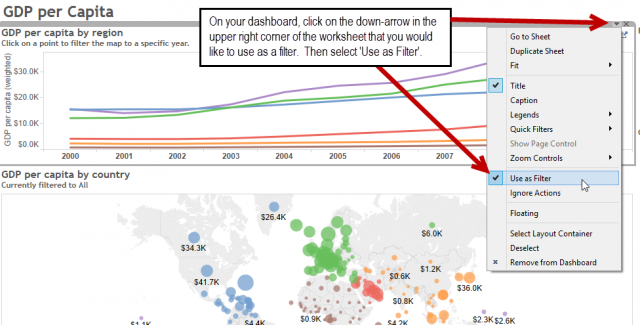
This means that whenever a report consumer clicks on a data mark, it will automatically filter the entire dashboard on that value. Boo yah!!
Mastering Best Practices
If you’re interested in becoming a Tableau Server guru, then learning these performance best practices is essential. Check back frequently as we add new posts and dive deeper into each point in the Tableau Performance Checklist.
Another great way to identify best practices is to leverage the insights offered by our Performance Analyzer, part of Workbook Tools for Tableau. It will examine all of your workbooks, worksheets, dashboards and data sources against a list of best practices to ensure that you’re using all the tips and tricks to guarantee your visualizations are moving at light speed.
As always, feel free to get in touch with us if you have any questions regarding performance or anything Tableau related! We’d be happy to help.
