
Tableau Deep Dives are a loose collection of mini-series designed to give you an in-depth look into various features of Tableau Software.
In the last post of our series on custom sorts in table calculations, we’ll examine one of the most common questions that I get from Tableau Training. In fact, I just had this question last week in Perth, Western Australia by a student named Mayank. Here’s the question:
“How do I sort on discrete measures?”
Often, we make measures discrete so we can include them in the header as a number and visualize a different measure in the chart. Let’s use custom sorts to make this work.
Sorting on Discrete Measures
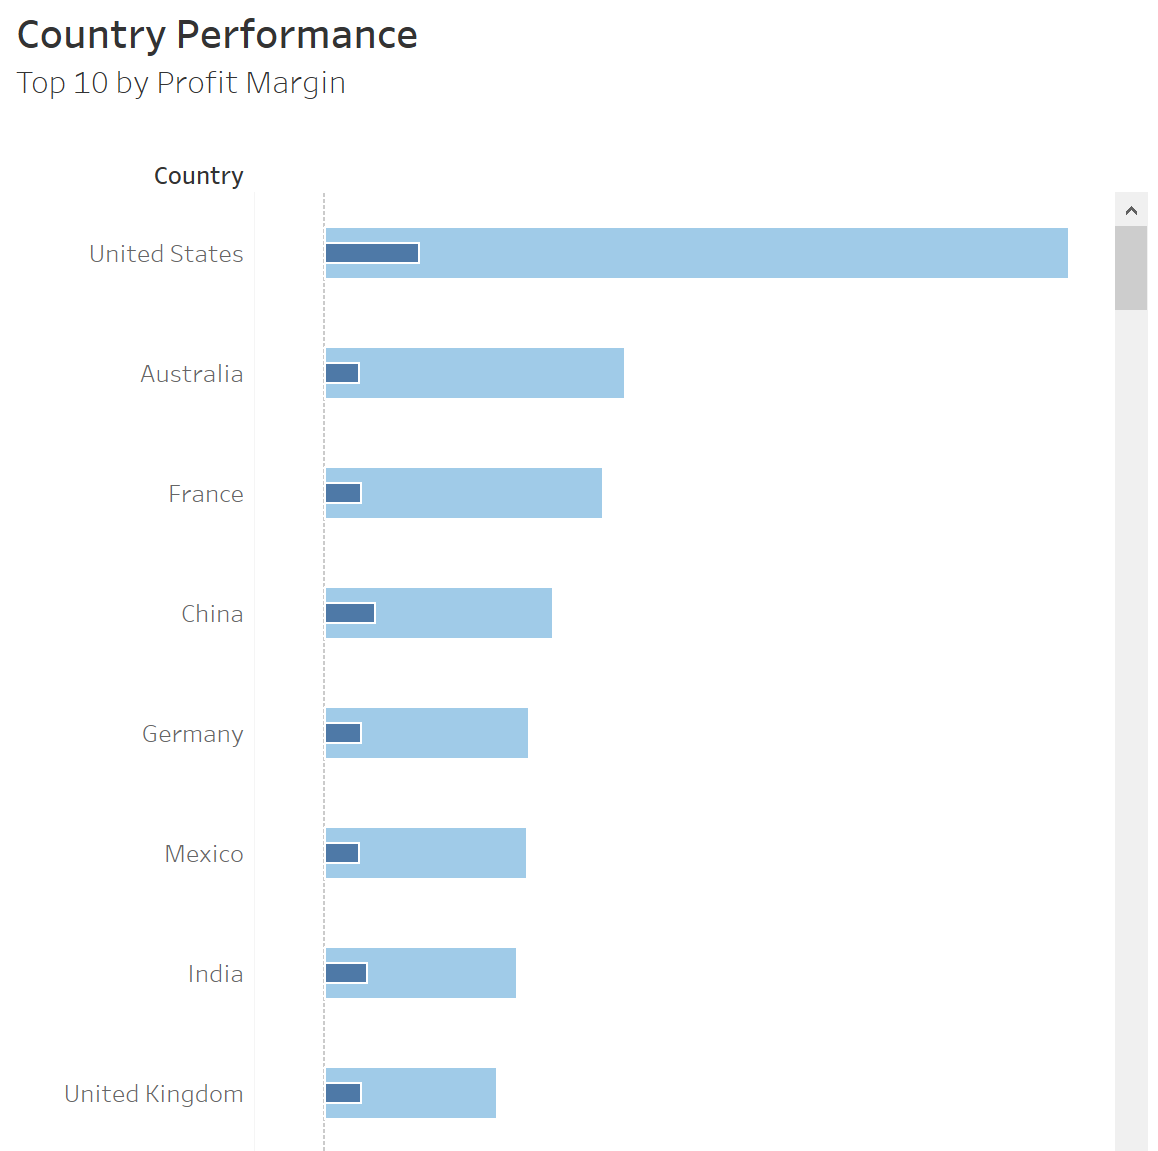
I want to build a chart that compares sales and profit as marks but then sorts the table off a measure I’m making into a discrete header. How about a top 10 by profit margin? Let’s start with our bar-in-bar graph by comparing my sales as the underlying bar to profit as the top bar:
I’m going to add Profit Margin alongside the name of the country as a discrete header. It won’t appear as a mark, but that’s fine because anything else on my bar-in-bar graph would probably start to detract from the story I’m trying to tell with my data. I’ll start with my calculation for profit margin:
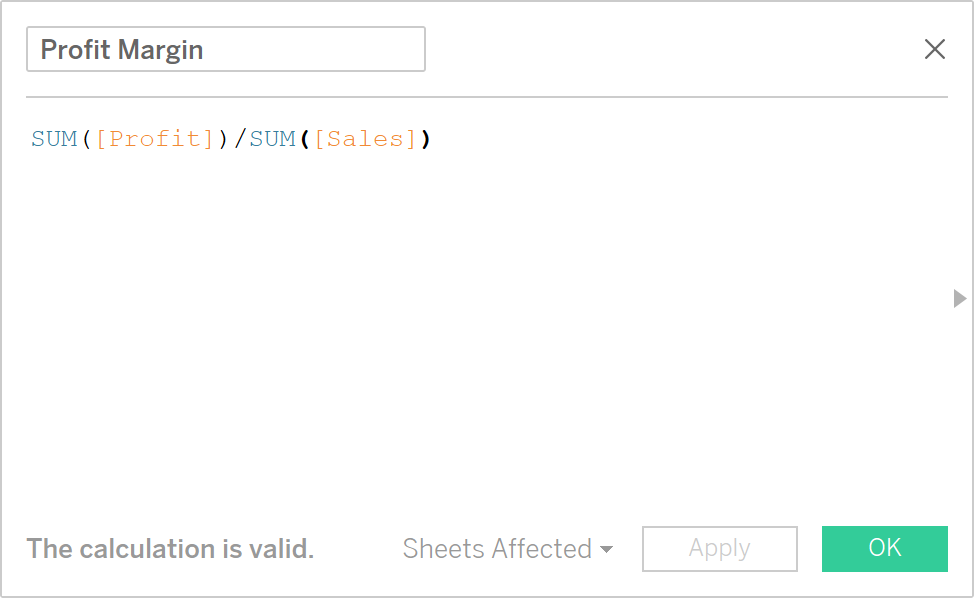
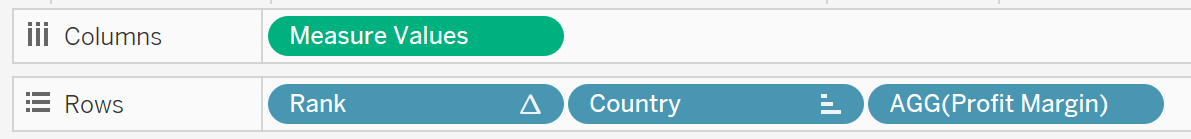
Remember, on weighted averages we have to aggregate the field first and then do our ratio, otherwise we get a row-level calculation, which is going to give us the wrong number and perform slower. Now I’ll take our Profit Margin and drag it to the Rows shelf as a discrete field:
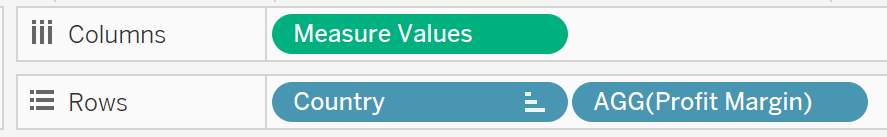
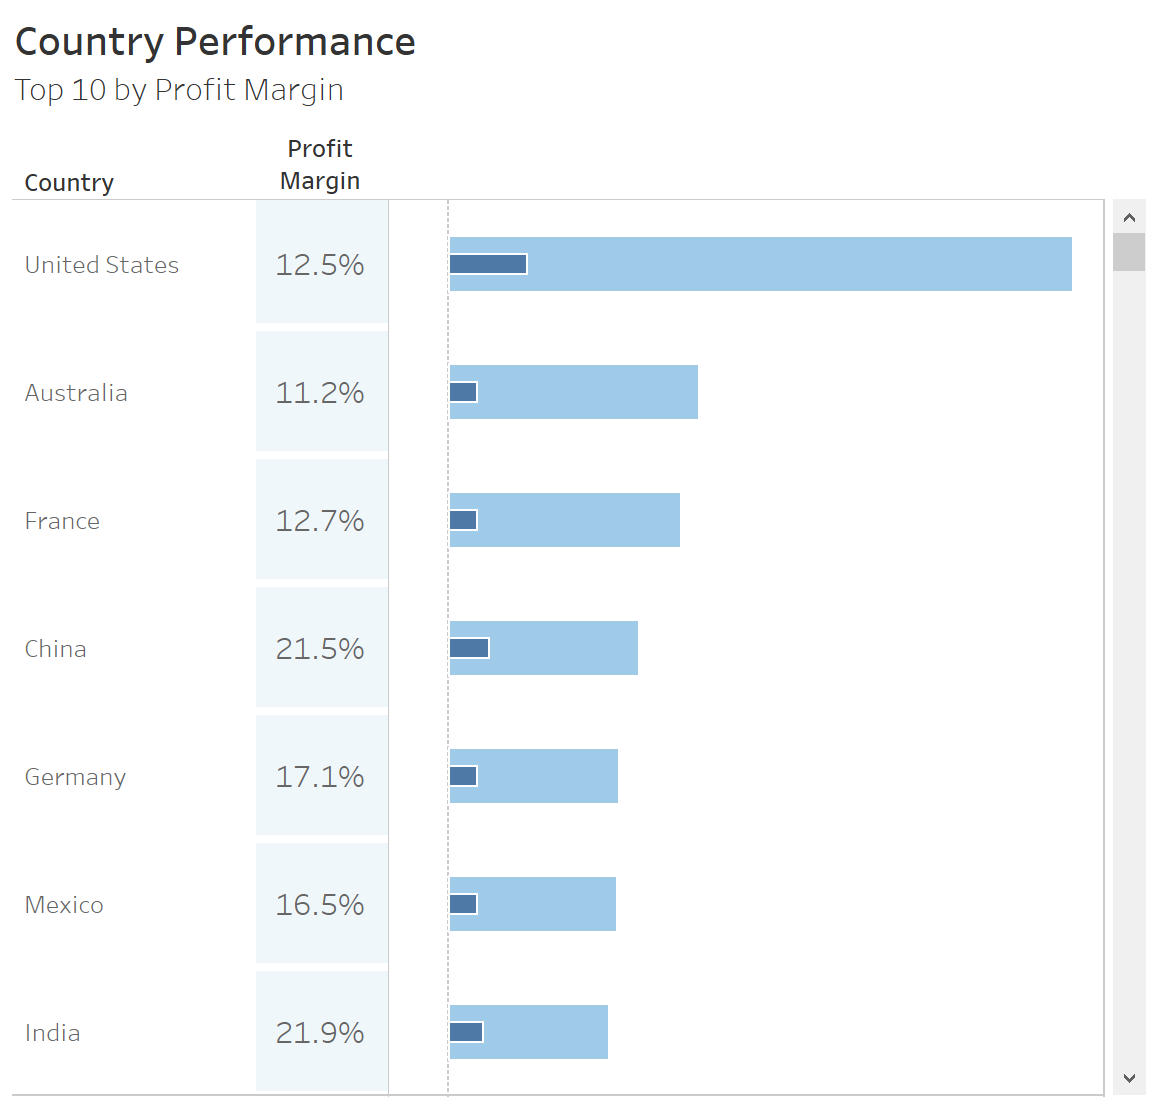
Profit Margin has AGG() around it. Tableau uses this designation to let us know that this field is already aggregated inside of the calculation. With a little bit of formatting on our font, shading and borders, we get this view:
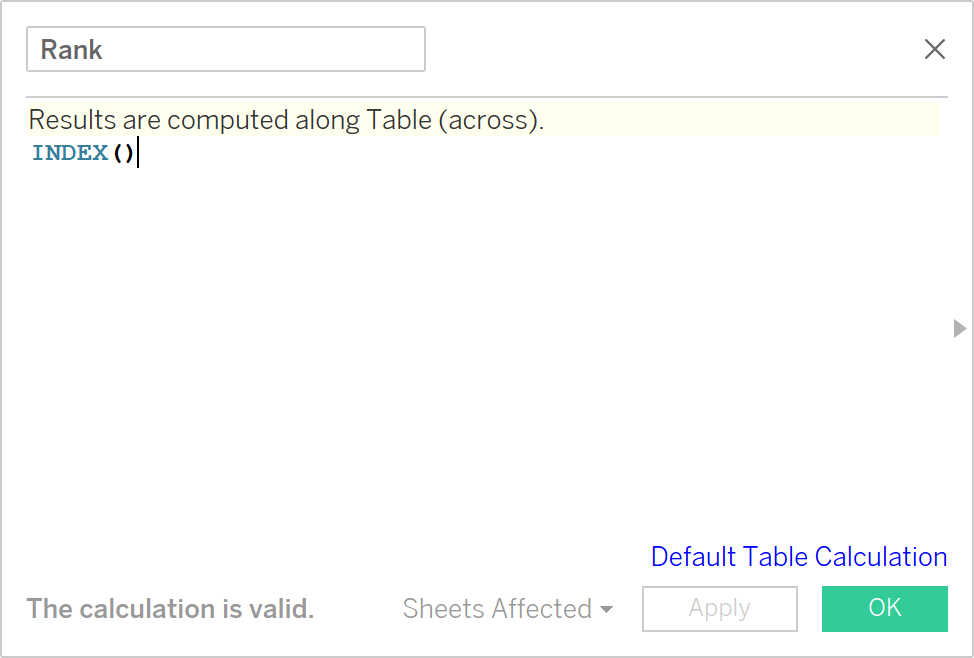
I’d like to sort this table by the Profit Margin percentage, but I cannot use a conventional because it is not a measure in the chart. It is a part of the header. To tackle this, let’s create a new calculated field called Rank that just has the INDEX() function inside. By definition, INDEX() is a table calculation, which is why you see the “computed along Table (across)” and the rest:
Again, I want to make this measure discrete and add it to the Rows shelf, but this time at the very beginning:
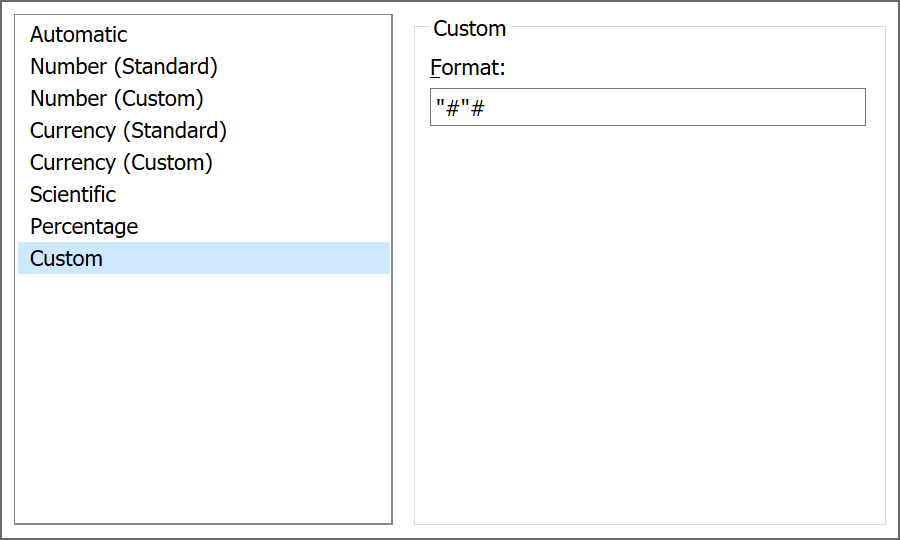
I’m going to add some custom formatting to this field to add a # symbol in front of the number. For me, it just makes it very clear that it’s a ranking value. Right-click on the Rank field on the Rows shelf and select Format. In the formatting menu on the left, find Numbers and apply this format:
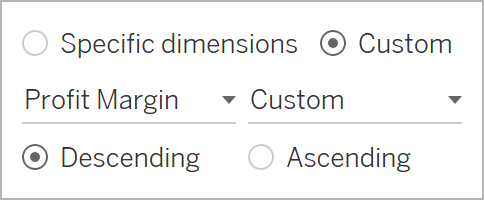
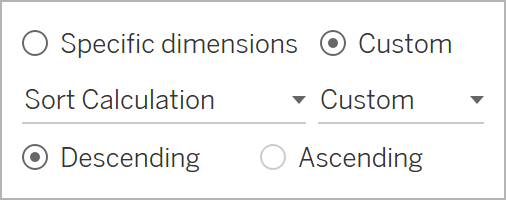
Now let’s add our custom sort to our table calculation which will allow us to use Profit Margin as the measure to sort our Country field. Right-click on your Rank field, select Edit Table Calculation to get into the table calculation window. Start by changing Compute Using to Specific Dimensions:
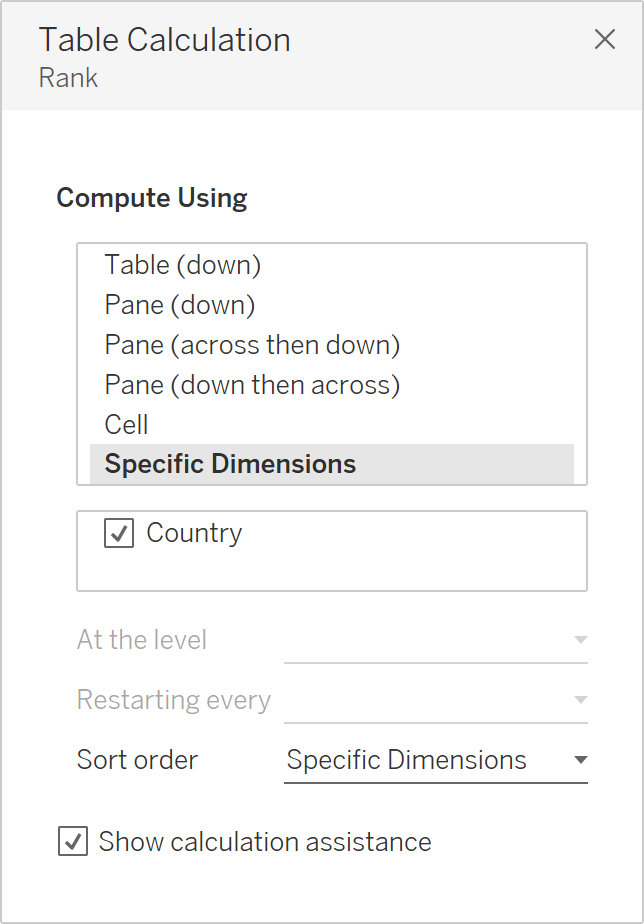
That will open up the option of a custom sort under Sort Order. Find Profit Margin in your drop-down list and select Descending to have it from highest to lowest:
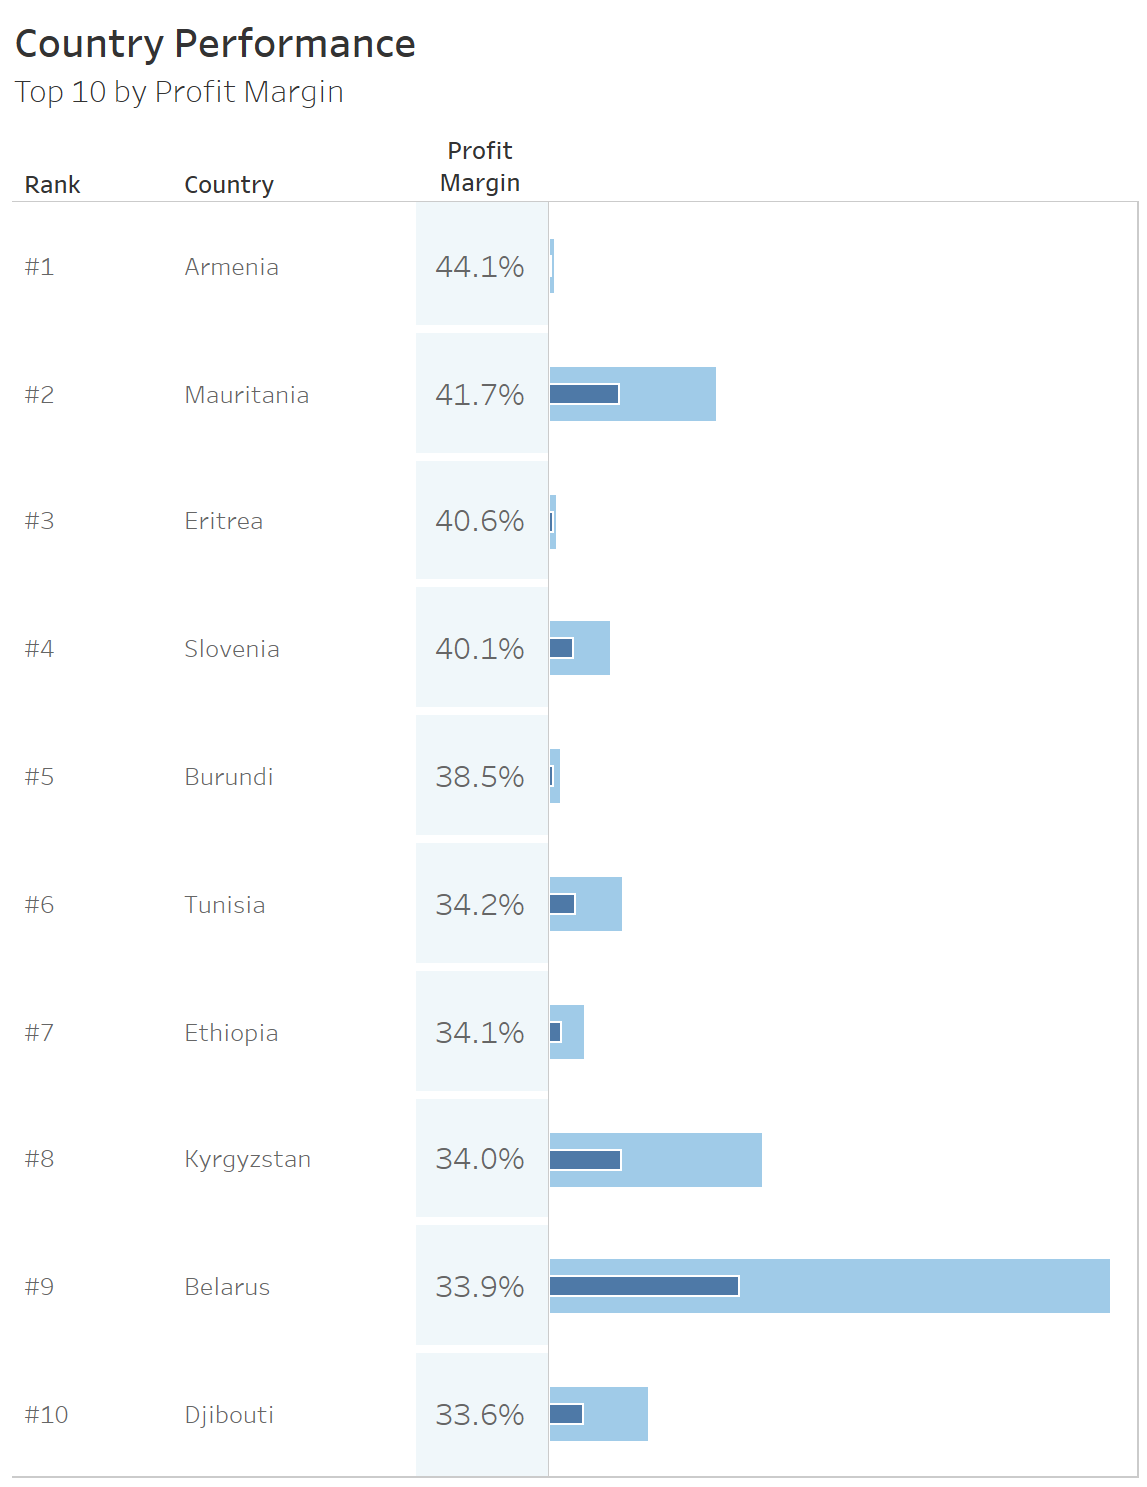
Finally, drag a continuous copy of Rank onto the Filters card and select a range from 1 to 10. This is the finished view of our top 10 by profit margin custom sort:
Add a Parameter!
If there’s a theme in my articles, it’s perhaps this: Tableau is the best BI tool on the market today and adding a parameter makes it even better! Let’s parameter-ize our custom sort so that our user can decide if they want to see a top 10 on Profit Margin (as a discrete header) or using profit or sales (as marks in our visualization).
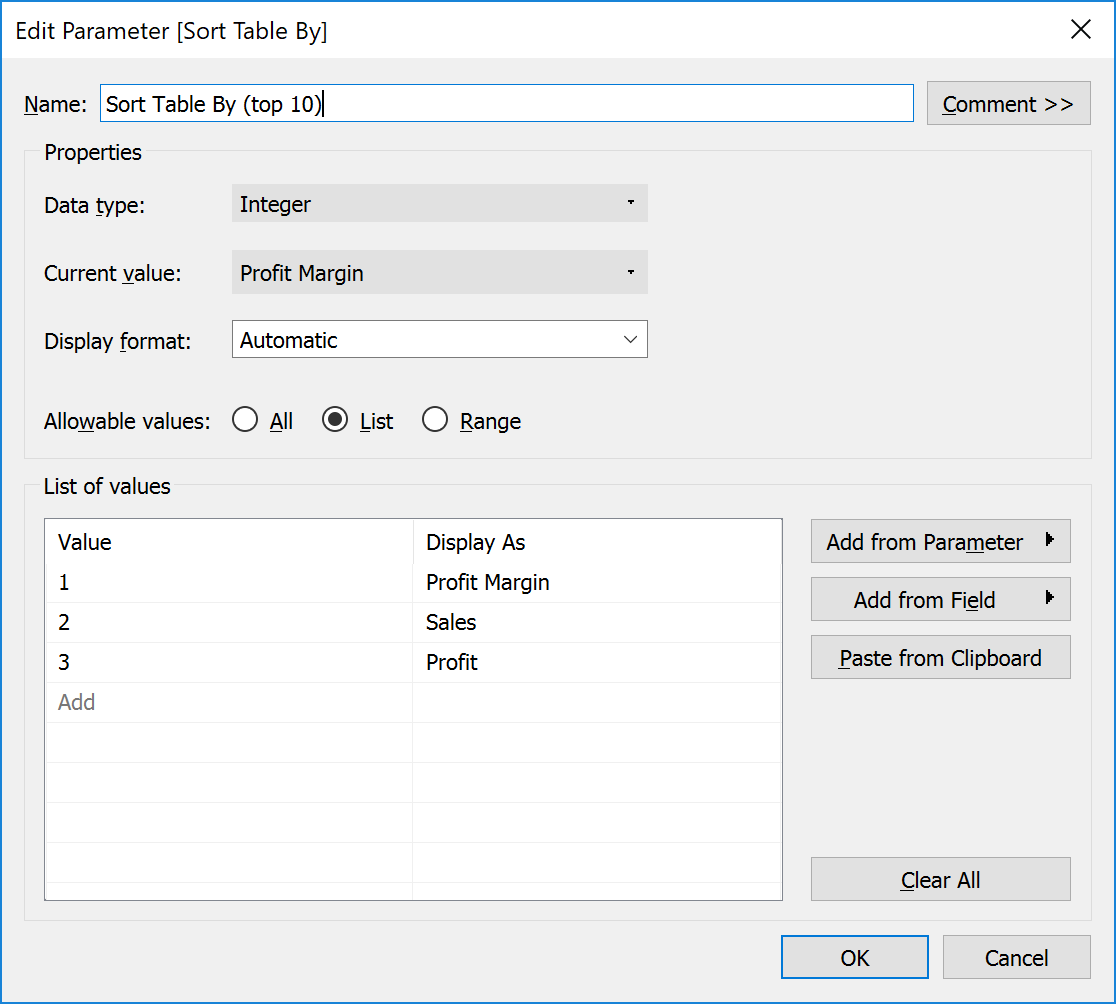
Step one is to build your parameter.
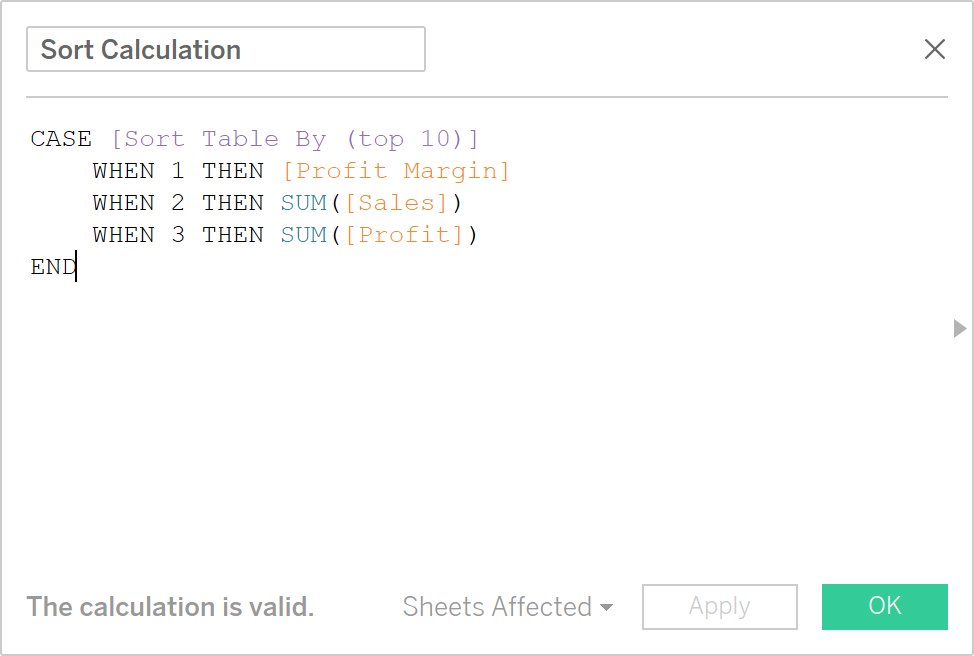
Right-click on your parameter and select Show Parameter Control. Now let’s create a calculated field that will utilize my report user’s selection from my parameter control. We’ll call it Sort Calculation:
All we have to do now is update any instance of our Rank calculated field to use the Sort Calculation as the field for the custom sort. Remember, we’ve got Rank in two places in the viz above – one of Rows and another in the Filters card. You’ll need to modify both.
Here’s our finished visualization, published out onto Tableau Public.
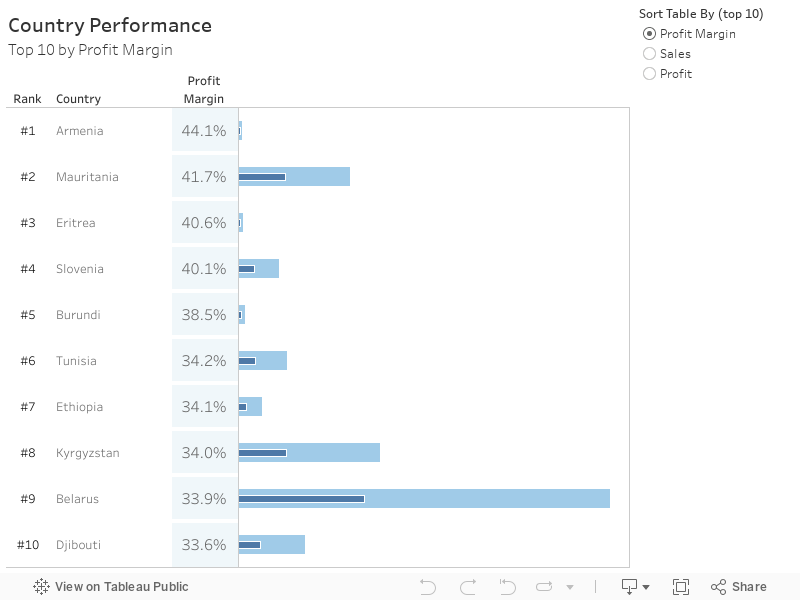
You could of course replicate this exact same functionality with multiple discrete measures as headers quite easily. Note, sunny Australia coming in on the top 10 on both sales (#2) and profit (#7). Aussie, Aussie, Aussie! Oy, Oy, Oy!
What’s Next?
Be sure to check back on the InterWorks blog for more content on Tableau and table calculations. Leave any questions or thoughts in the comments section below. Cheers!