
Tableau Deep Dives are a loose collection of mini-series designed to give you an in-depth look into various features of Tableau Software.
In the first three articles of this Deep Dive on Dashboard Design, we’ve constructed our proof of concept. All of the worksheets have been planned, built and laid out in the structure best suited for our dashboard objective. Now we’re going to talk about how we can make our dashboard interactive. Remember, this is Tableau, not just a pretty picture. Tableau is interactive and our dashboard should be, too.
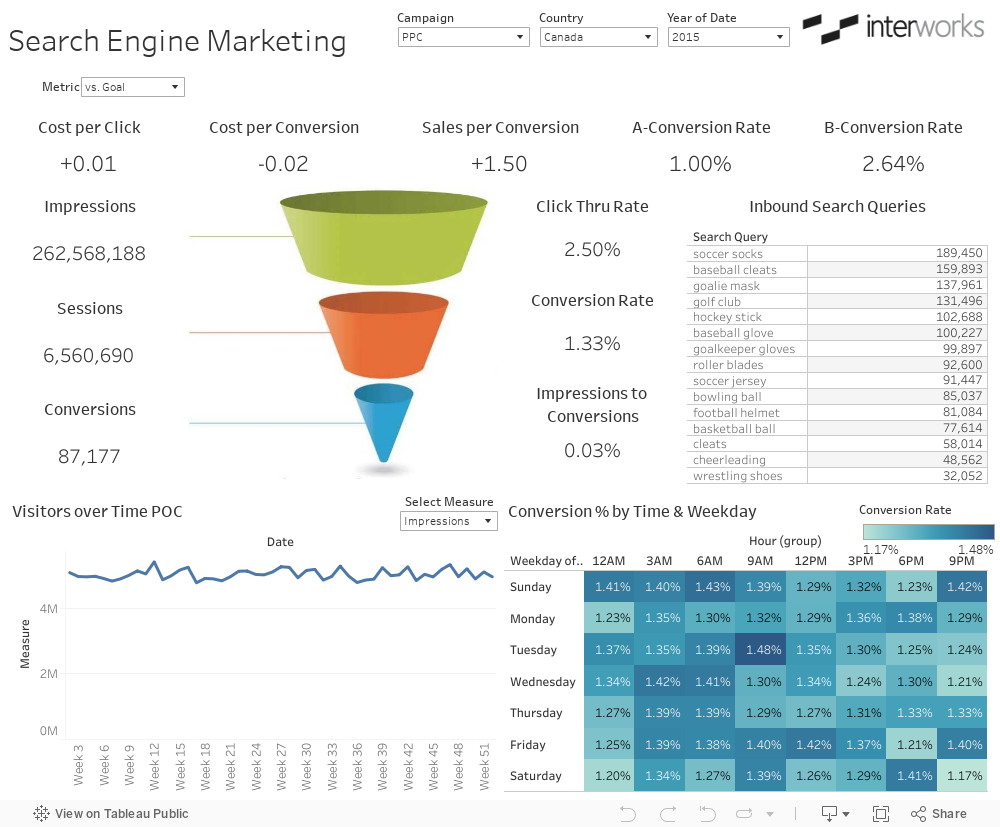
As before, we’ll start by discussing the theory and concepts behind dashboard interactivity and then we’ll apply it to our sample dashboard, a Search Engine Marketing reporting tool.
Concepts
User Adoption
The goal of any developer is to create a tool that gets used. An unused tool is a useless one. User adoption has to be at the forefront of any list of goals. Adding interactive elements to a reporting tool is a great way to bring your users into the tool. This is for two primary reasons. First, simply getting them to click or move the mouse cursor around means they are engaging. You are rewarding them for doing something inside of the view. With a lot of interactive elements, your user will be enticed to participate even more.
The other reason is expanding the breadth of who can use this dashboard. Our first view might speak to 70% of our users, but allowing them to drill down to a more detailed view, to change measures, to change dimensions or just simply change the range of dates, means that it can offer utility to as many users as possible. Rather than constructing multiple tools to accommodate different options or groups of users, make your dashboard adaptable to the needs of several users at the same time. It makes a far more robust reporting tool and reduces your time costs on maintaining multiple dashboards.
Interactive Options
There are a lot of great things you can do within Tableau Desktop to add interactivity. You can even add combinations of these elements for really cool features. They break down into four basic varieties: global filters, parameters, dashboard actions and tooltips.
GLOBAL FILTERS: Let’s start with global filters, also known as universal filters. These are standard filters that are created from one of the views in your desktop and then applied to more than the original worksheet. The term global filter implies that the filter affects every single view in that dashboard, but that’s not necessarily the case. They could apply to as little as two views, the original view and another.
PARAMETERS: Parameters are one of the most powerful elements in Tableau Desktop, because they can be used in a lot of different cases. Here are the main ones: calculated fields, histogram bins, reference lines, top N filters and customized table calculations. With all of these options, parameters can do all sorts of things, including completely swapping out the measures and dimensions in your view. This is how you can add multiple views within a single visualization with just a single parameter control.
For more information, check out the Parameter Deep Dive series.
DASHBOARD ACTIONS: Dashboard actions are unique features for dashboards. They allow worksheets the ability to interact outside of just the domain of their view. There are three types of dashboard actions: filter actions, highlight actions and URL actions.
Filter actions allow the selections in one viz to affect others. This can even be used to navigate between different dashboards. Highlight actions allow you to emphasize the marks in other visualizations by interacting with the source worksheet. The highlight will appear in the same visual style as the Highlighter tool or clicking on a value in the color legend. Finally, a URL action will help the user navigate to a web address from within the dashboard.
Dashboard actions will run on three different run on options: select (clicking with your mouse button), hover (moving your mouse cursor over a mark or header) and menu (a text link within the tooltip to activate the dashboard action).
TOOLTIPS: Finally, tooltips are the last option for interactivity. They are also the most often ignored or forgotten. However, we can add a substantial amount of additional information into a tool tip to reward our user’s curiosity. Keep in mind that if the metric is essential to your interactor’s interests, it should probably be visualized in some format, as well as being included in the tool tip.
Practicum
As I mentioned in our preparation in previous articles, we are going to focus on global filters, parameters and tooltips for our Search Engine Marketing dashboard. We’re missing dashboard actions, so I’ll include a URL action for our top search terms.
Global Filters
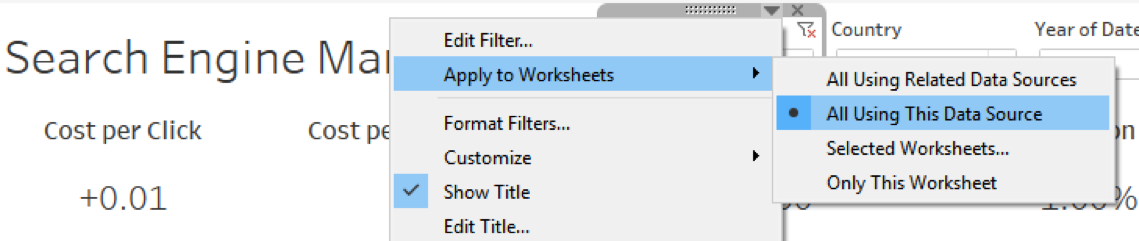
We have three different filters on our dashboard: campaign, country and year. I’d like the filters to apply globally to all my worksheets on this dashboard. The campaign filter only uses a single data source. So, I can simply broaden its application to every worksheet using that data by selecting the drop-down arrow in the top right-hand corner to select those worksheets.
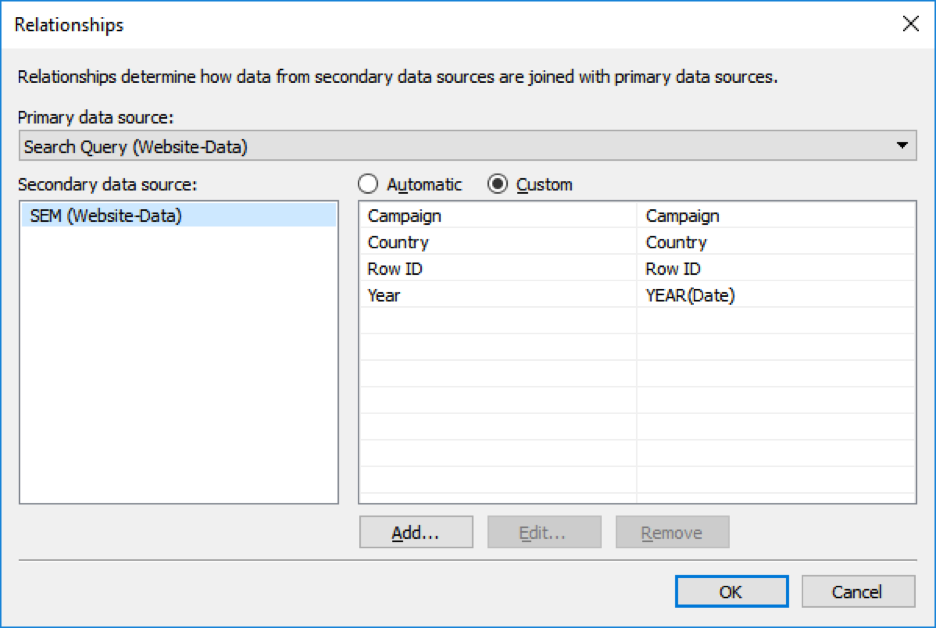
It gets a little more complicated, because I’m using two different data sources. This applies to my country and year filters. Since I’m using 10.2, I can create a data relationship between my two data sources to get that global filter to work as a cross database filter. To create this relationship, let’s go to a worksheet and access the Data drop-down menu and select Edit Relationships.
I’ve got two data sources: Search Query (Website-Data) and SEM (Website-Data). I need to make sure they are related on the campaign and year dimensions like so:
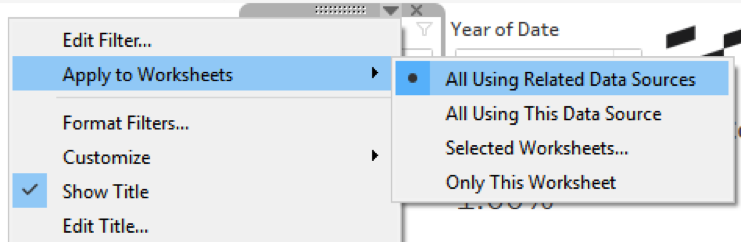
Now that the relationship is set up, I can use the same feature with my filters to apply them across related data sources.
Let’s do the same process one more time for the year filter.
Parameters
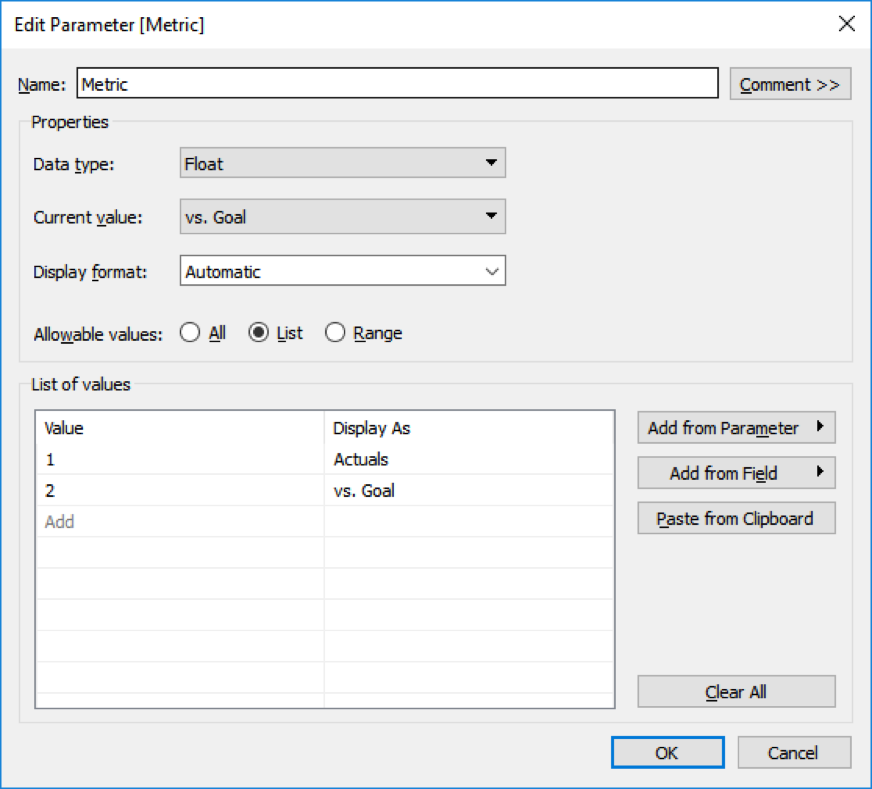
I’m going to add two different parameters to my dashboard. The first is going to affect all of the key metrics I’m reporting across the top of my view. I want a simple toggle to show either actual performance or performance against goal. This will add some context as to how well or how bad my campaigns are performing for click thru rate, cost per click and cost per conversion. We don’t need to go through the Ins and Outs of creating a parameter here. Check out the Deep Dive on Parameters for more information on that.
Here are the details of the first parameter:
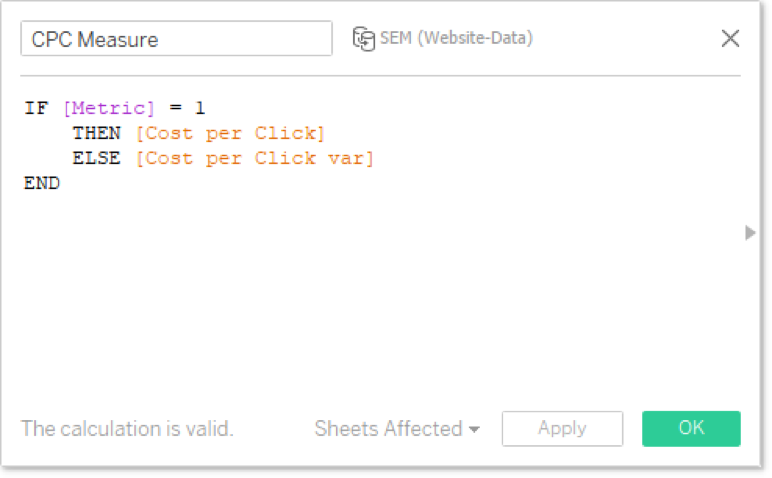
Here’s the calculation that we used with our Metric parameter, one of three for each of our KPIs across the top:
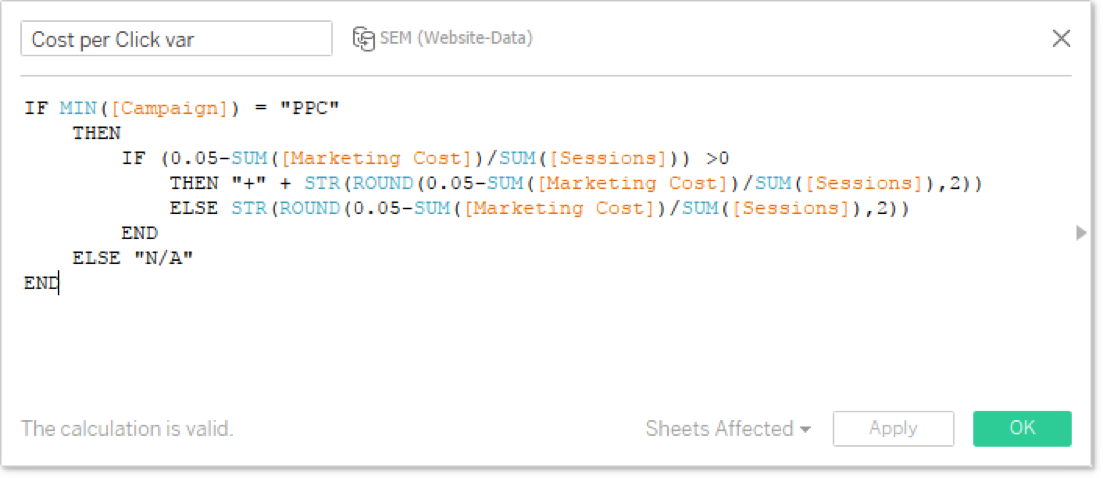
The variant calculation referenced with the ELSE clause above needs to convert the dollars into a percent difference. For simplicity’s sake, I hardcoded the goals into the calculation. Here’s a sample (again of three):
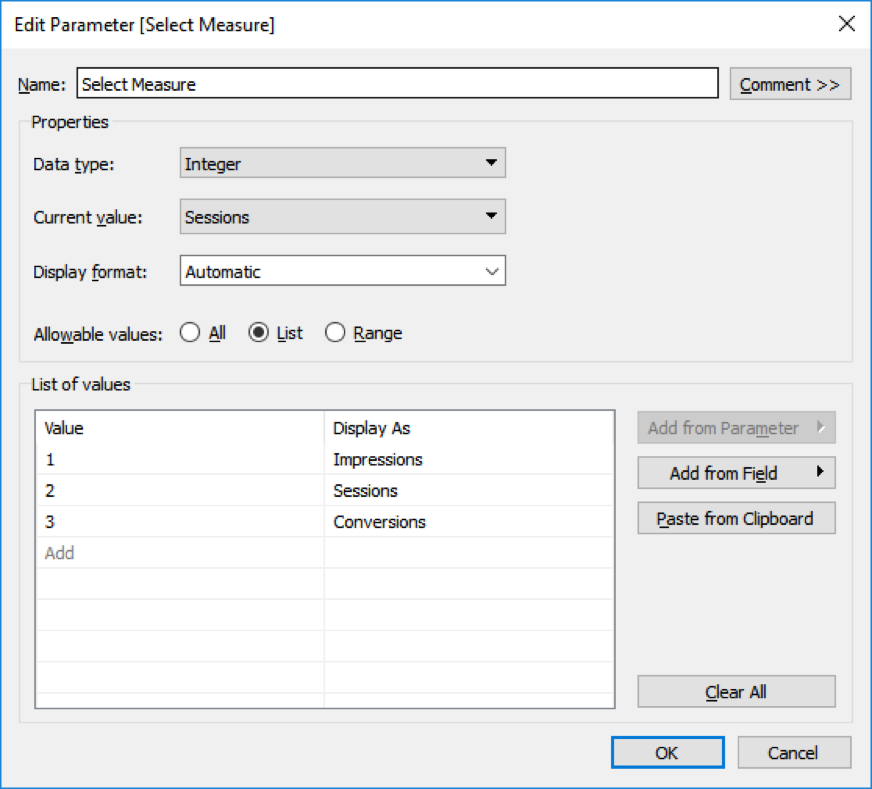
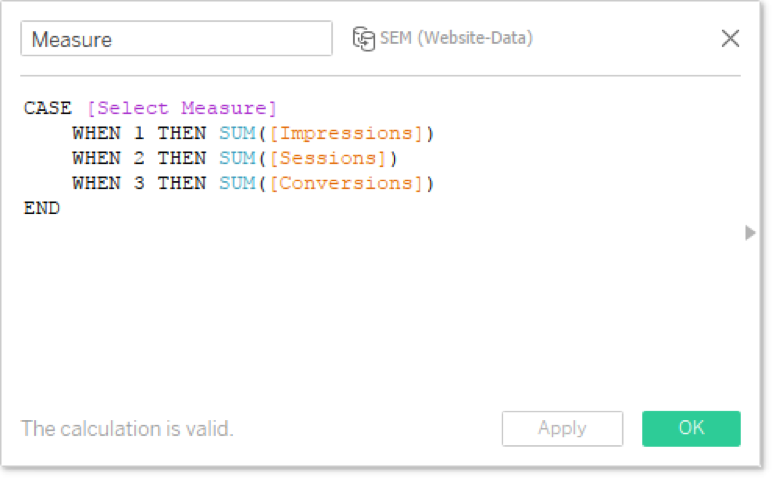
Our second parameter is going to switch our performance from a time line graph to a variable measure. I’m going to let my user decide if they want to see impressions, sessions or conversions. Here are the specifics:
And here is how we used it in our view:
We are now all good to go with our parameters.
URL Action
As mentioned above, there are three types of dashboard actions: filter, highlight and URL. For our view, we’re going to include a URL action to the search results for a particular term. We have campaigns in four different countries: USA, Canada, England and Australia. If I want to see relevant search results, I’ll need to programmatically search within each country’s version of Google. So I’m going to a calculated field to do just that:
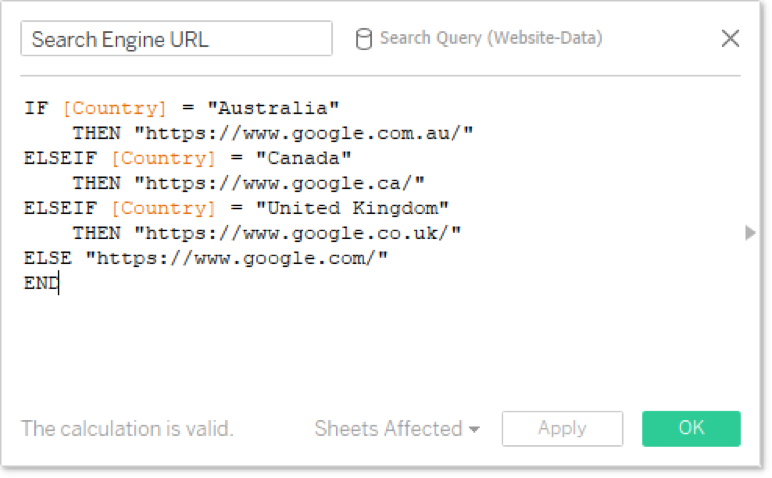
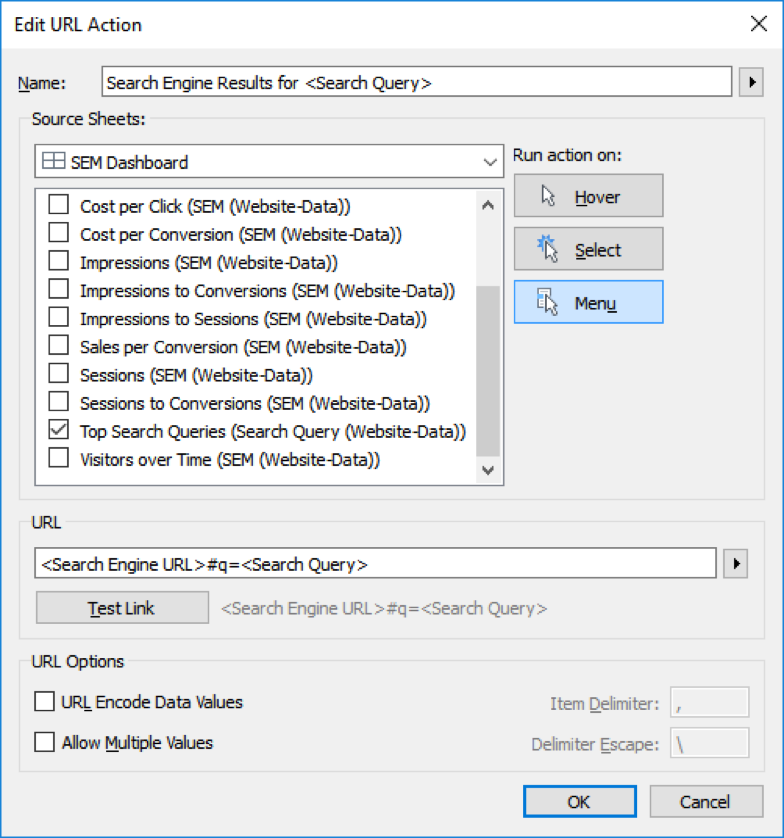
Now, I’ll use that in combination with the search term to generate my search query string in the web browser. I’ll drop my Search Engine URL field into my Top Search Queries text table and then unselect Show Header, so that it isn’t visible, but it is included in my view’s detail. Here’s my URL action:
Tool Tips
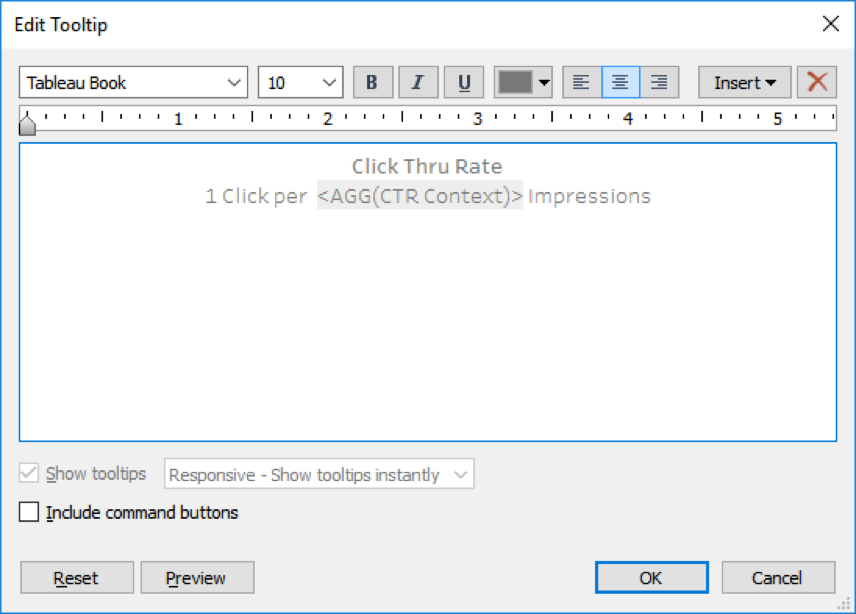
I’ll go through each of my visualizations to ensure that only useful information is in each tooltip. I also want to turn off all of the tool tip commands. My users are going to need them and it’s better to reduce functionality that is unneeded. To turn off tool tip commands, unselect the option on each tool tip for your dashboard labeled, “Include command buttons.”
Here’s an example of a finished tool tip:
Presto. Our dashboard now has a load of interactive features.
What’s Next?
The next article is a fun one and is overlaid with our proof of concept dashboard and all our visual best practices. Our tool is functional right now, but adding the right combination of style, color, spacing and consistency will do wonders in making it appealing, easy to use and quick to adopt. Until then, make sure to include any thoughts or questions in the comments section below. That’s all for now, folks. Check back soon for part five of the Tableau Deep Dive on Dashboard Design series.
