
Tableau Deep Dives are a loose collection of mini-series designed to give you an in-depth look into various features of Tableau Software.
At first glance, it could appear as if there is redundancy between level of detail calculations and table calculations. In fact, you might wonder if you could use table calculations to accomplish much of the functionality for LODs. Let’s consider a simple use case for percent of total.
% of Total Use Case
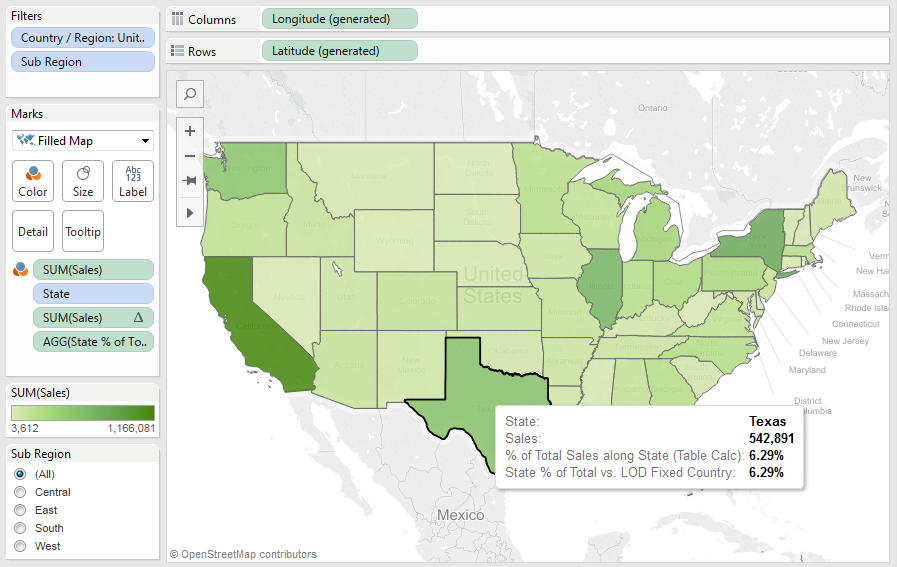
We want to build a filled map of our business based in the United States. Our business is divided into regions (South, East, West, etc.), and our regional managers want to be able to filter to their particular region. Here’s our first draft of our visualization (using Superstore Sales Training.xlsx):
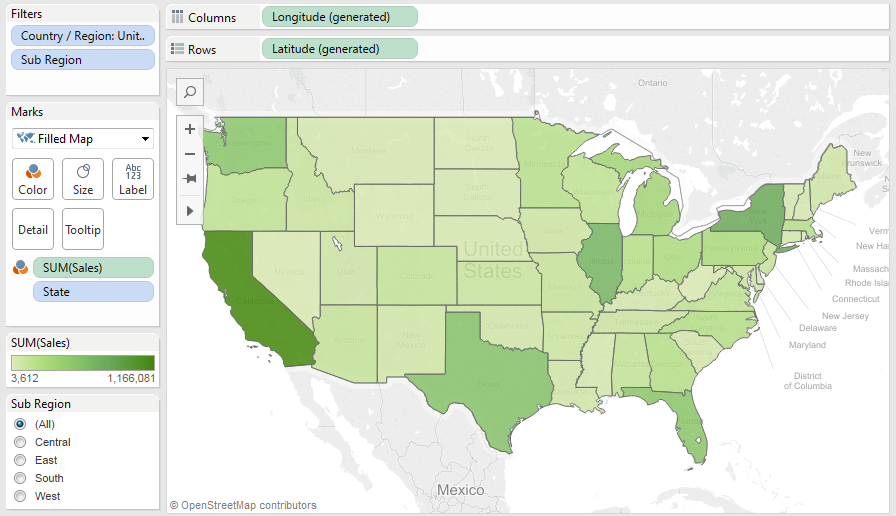
Here’s where our use case comes in: In the tooltip for each state, I want to see the percent of total for each state compared to national sales.
The Table Calculation Option
This use case is super easy! I’ll just drag Sales to my detail, add a Quick Table Calculation for % of total and then add it to my tooltip! Here’s what I get:
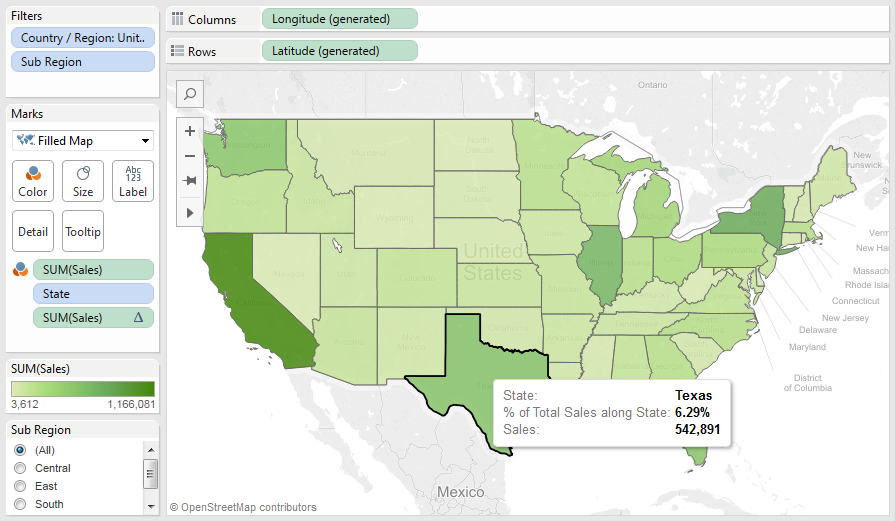
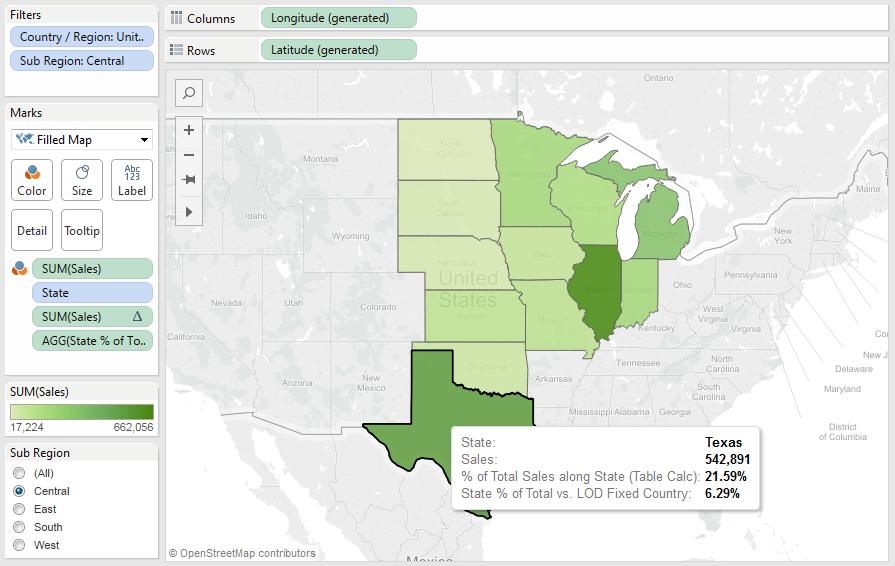
Success, right? No, not really. Look what happens when I apply my Sub Region filter and check the percent of total again:
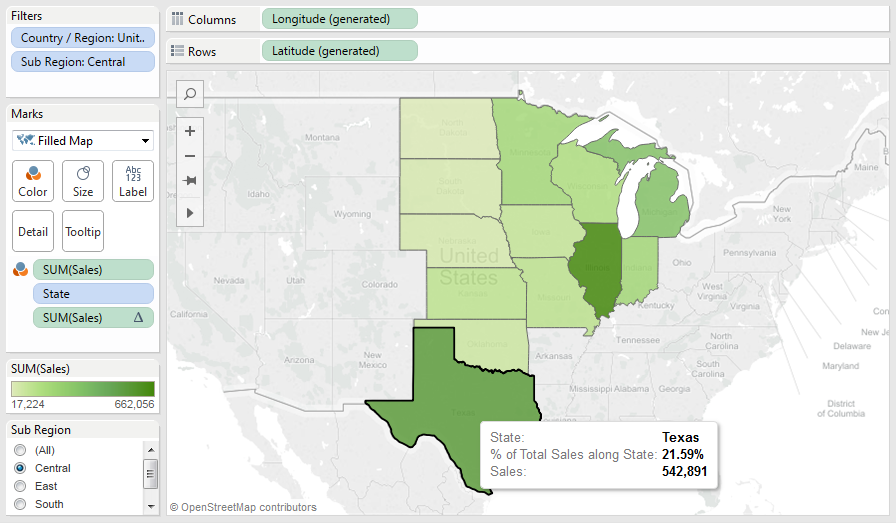
Our percent of total has dramatically changed, and that’s because it is taking the percent of total on what is actually being displayed in the visualization. Why is it doing this?
Where Calculations Occur
To dig into this problem, we have to understand how Tableau processes calculated fields, filters and table calculations. This is the order of actions that Tableau takes every time the visualization is rendered:
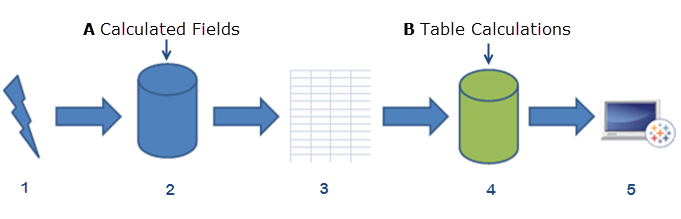
- Tableau generates a query and sends it to the database.
- The database processes the query. Very important to our discussion, this is where Tableau considers calculated fields, including level of detail calculations.
- Tableau generates a temporary table that is already filtered and aggregated with any new columns produced as a result of calculated fields.
- Only after all of that are table calculations applied.
Understanding this sequence is essential to understanding one of the primary differences between table calculations and LOD calculations. Table calculations are applied last, just before Tableau renders the visualization. Any filters that are applied happen before table calculations whereas calculated fields are handled in step #2 inside of the database, very early in the process.
Re-Visiting % of Total
We need to add a level of detail calculation within our sales map to compare filtered results against the whole. To accomplish this, we’ll need to fix our denominator sales on the Country/Region level of detail. Makes sense that we’ll use the Fixed LOD calculation!
Here’s the calculation we’ll use, named State % of Total vs. LOD Fixed Country:
SUM([Sales])/SUM({ FIXED [Country / Region]:SUM([Sales])})
And here’s our result at the national level. I’ve left in our table calculation as a comparison:
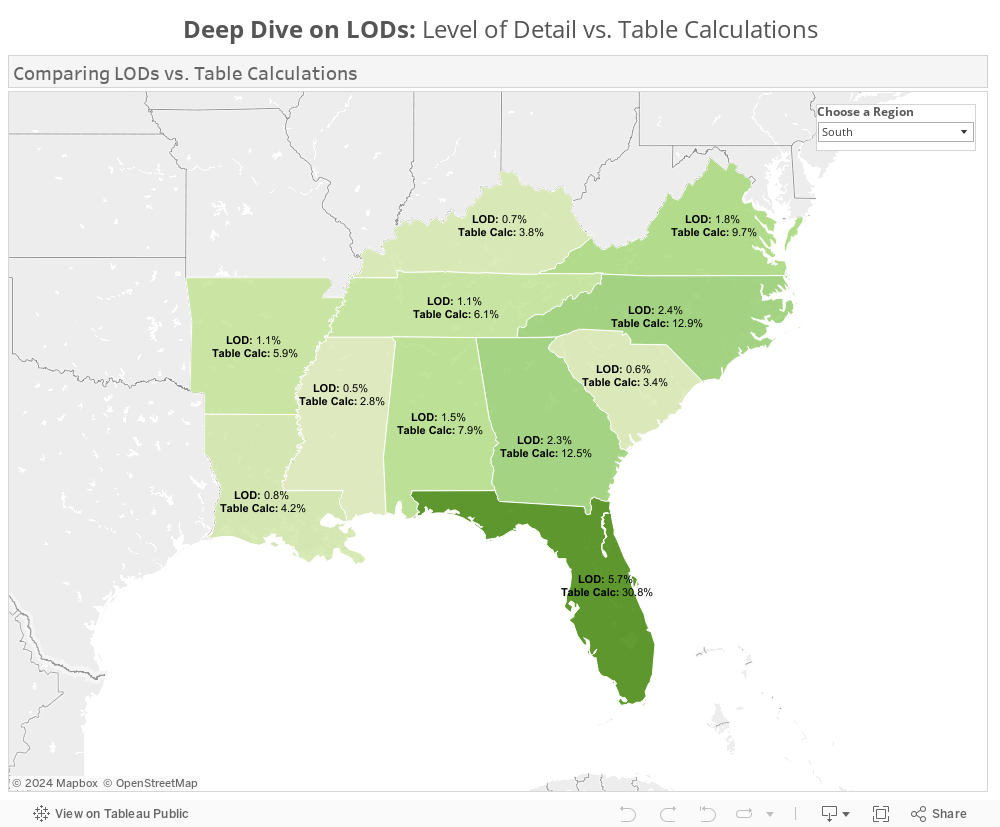
Both the table calculation and LOD calculation are returning the same result when we view the entire country, but it’s when we filter again that the LODs prove their worth for this use case:
Eureka!
Obviously, there are any number of great use cases for LOD calculations beyond just this basic example. We’d love to hear how you have used the new level of detail functionality in your views. That said, if you want to explore this specific example further, simply interact with the workbook below or download it at the bottom of this post. Be sure to add your thoughts and questions in the comments section, as well!
Hope this Tableau Deep Dive helped. Be sure to look for our next exploration of another Tableau topic coming soon!