Questions from Tableau Training: Down the Aggregation Rabbit Hole

Data

Questions from Tableau Training: Down the Aggregation Rabbit Hole

Our Certified Tableau Trainers are asked a myriad of questions each day. In this series, they share some answers.

Every single day, I get emails from former students asking for help with everything from visual best practices to calculated fields. Sometimes the questions are quick while others require more thought. Some may be deceptively simple questions that turn into something more complicated than first thought.

What started as a relatively straightforward question from a student led me into a quest to better understand how aggregations work in conjunction with each other within reference lines.

Here is the question that kicked all this off:

Goran, from a virtual Desktop II class, was trying to compare this year’s monthly sales against last year’s maximum sales.

Note: For the purposes of demonstration, I am using the Sample-Superstore data set that comes preinstalled with Tableau Desktop.

The first calculation I will make will isolate 2018 sales:

IF YEAR([Order Date])=2018 THEN [Sales] END


Then I will make a very similar field to isolate 2017 sales to use in a reference line:

IF YEAR([Order Date])=2017 THEN [Sales] END


When I drag over the 2017 Sales field onto Detail to use it in my reference line, I can change the aggregation to Maximum. Then, when I actually create my reference line, I can change the aggregation of the line to sum.

Let’s take a look at this first permutation of our Maximum Sales on Detail, with our reference line set to the Sum of our Maximum Sales:

Tableau Reference Line Set to Sum of Maximum Sales

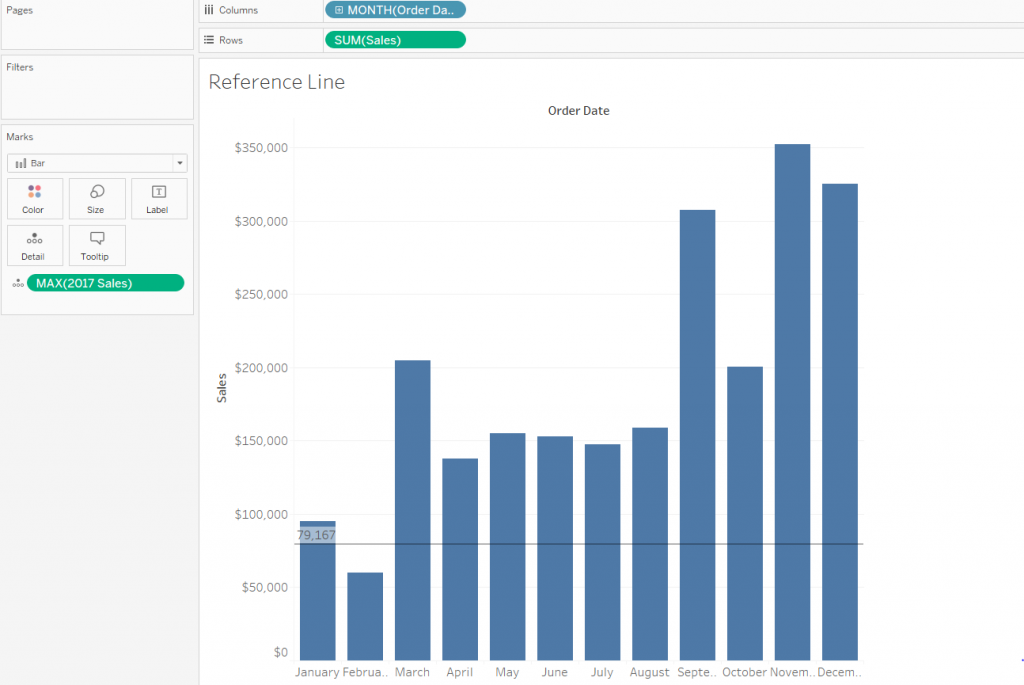
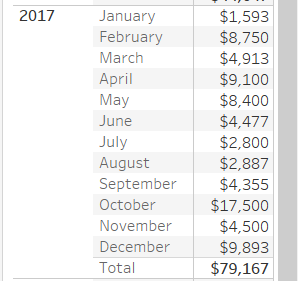
Our reference line appears at $79,167. If we look at a breakdown of the data, we see that this is the sum of the single highest transactions for each month of 2017.

Sum of Highest Transactions

Is this what we are looking for? To really answer this question, we must ask ourselves: What is the reference line that we are really trying to see? A line showing us the total of all those single transactions, or a line at the value of 2017’s single highest month of sales? If the latter is the case, we need to switch around our aggregations.

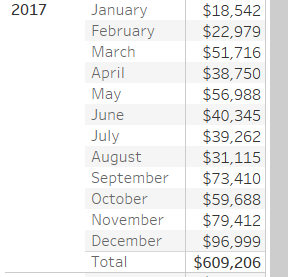
If we change our MAX(Sales) pill to SUM(Sales) and change our reference line to Maximum, we will now get a line at the value for the single highest month in 2017, December:

Highest Month 2017: December

New Reference Line in Tableau

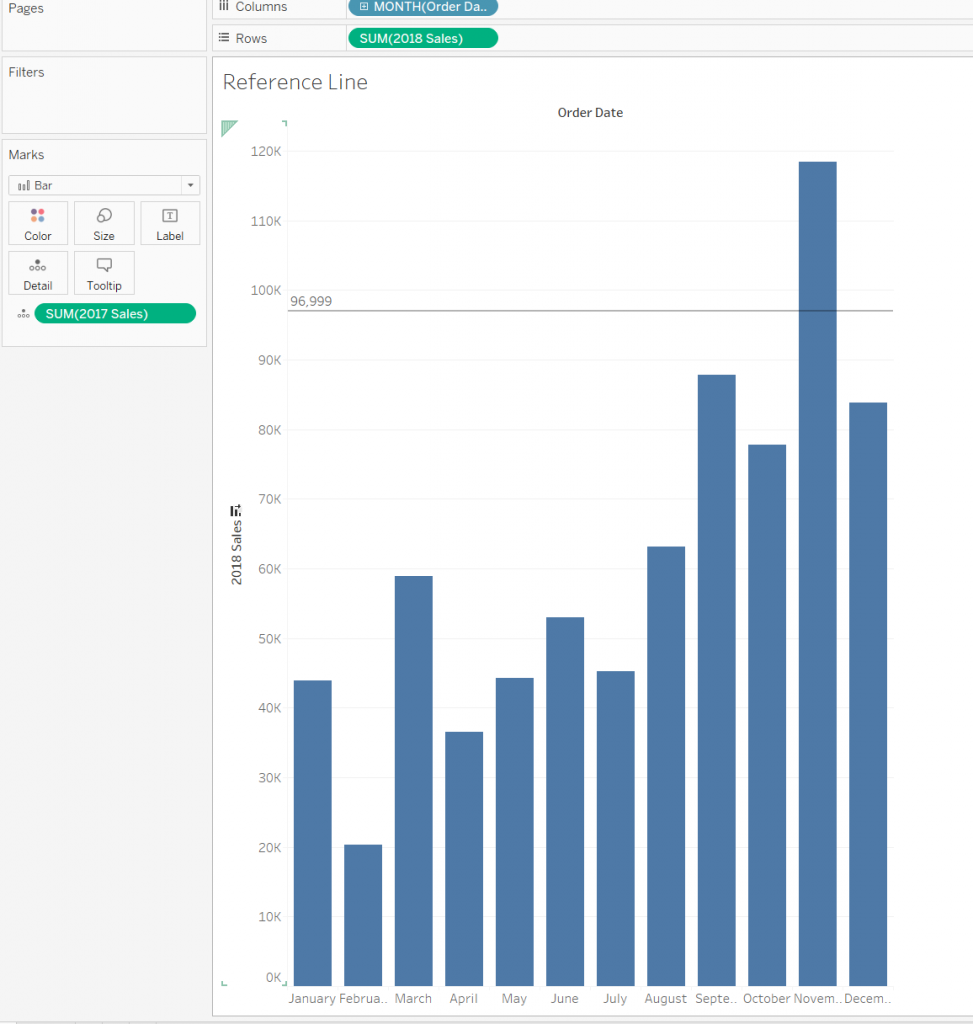
You can try out many different combinations of aggregations on both your pill and your reference line, but you need to be cognizant of what the business problem is. In this case, since we wanted to compare each month of 2018 to 2017’s highest monthly sales, this combination works.

Make sure whenever you are creating a reference line that the aggregation is correct – and don’t skip the step of checking your work in a crosstab if you want to be sure!

Thank you for the question, Goran, and for the challenge!

Want More Questions from Tableau Training

  1. Questions from Tableau Training: Quick Filter Interaction
  2. Questions from Tableau Training: Labeling with Table Calculations
  3. Questions from Tableau Training: Speeding Up Presentation Views when Using Tableau
  4. Questions from Tableau Training: Dashboard Actions
  5. Questions from Tableau Training: Business Day Calculations
  6. Questions from Tableau Training: Adding Gaps Between Bars
  7. Questions from Tableau Training: When to Pivot Data in Tableau
  8. Questions from Tableau Training: Adding Conditional Formatting
  9. Questions from Tableau Training: Setting Weekday Start
  10. Questions from Tableau Training: How Do ZIP Codes Work in Tableau?
  11. Questions from Tableau Training: The Small Grey Bar Within a Quick Filter
  12. Questions from Tableau Training: Matching Mark Color
  13. Questions from Tableau Training: Showing the Null Indicator
  14. Questions from Tableau Training: Can I Manually Set the Colors of a Stepped Gradient?
  15. Questions from Tableau Training: How Can I Get Box Plot Data into a Crosstab?
  16. Questions from Tableau Training: How Do I Clear a Worksheet? Make a Copy?
  17. Questions from Tableau Training: Opening URL Actions Inside of a Dashboard
  18. Questions from Tableau Training: Can I Move Mark Labels?
  19. Questions from Tableau Training: How Can I Use My Current Report to Create a Viz?
  20. Questions from Tableau Training: Can I Create Text Hyperlinks on a Dashboard?
  21. Questions from Tableau Training: How Can I Transform My Crosstab into a Flat List?
  22. Questions from Tableau Training: Labeling the Top N
  23. Questions from Tableau Training: How Can I Customize Charts with Parameters?
  24. Questions from Tableau Training: Combining Measures into a Single Line
  25. Questions from Tableau Training: How Can I Create Custom Color Palettes?
  26. Questions from Tableau Training: Can a Top N Parameter be Nested Within Other Fields?
  27. Questions from Tableau Training: Conditional Scope on Tableau Calculations
  28. Questions from Tableau Training: Top Ten Plus N
  29. Questions from Tableau Training: Dynamic Label Positioning
  30. Questions from Tableau Training: Using Cross Joins to Solve Active Tickets
  31. Questions from Tableau Training: Top N Highlight Table
  32. Questions from Tableau Training: How to Use Specific Dimensions in Table Calculations
  33. Questions from Tableau Training: Moving Reference Line Labels
  34. Questions from Training: Comparing Metrics for Same Weekday in Previous Year
  35. Questions from Tableau Training: Colouring Specific Columns and Rows in a Crosstab
  36. Questions from Tableau Training: Creating a Custom Legend as a Sheet
  37. Questions from Tableau Training: How Can I Draw a 45-Degree Angle?
  38. Questions from Tableau Training: Down the Aggregation Rabbit Hole
  39. Questions from Tableau Training: Percent Change from Previous Period on a Map
  40. Questions from Tableau Training: Union File Names as Years
  41. Questions from Tableau Training: Conditional Coloring on Sparklines
  42. Questions from Tableau Training: Moving Column Headers to the Top of the View
  43. Questions from Tableau Training: Isolating Rank with Parameters and Calculations

More About the Author

Liz Jensen

Analytics Consultant
Alter Your Analysis: Unofficial Holidays We know what dates Halloween, Christmas, and US Independence Day are on. But what about National Dogs in Politics Day or National ...
Alter Your Analysis: Women’s World Cup Match Wins In this second installment of Alter Your Analysis, I am tackling Alteryx’s Weekly Challenge 169: “Using the values in the attached file ...

See more from this author →

InterWorks uses cookies to allow us to better understand how the site is used. By continuing to use this site, you consent to this policy. Review Policy OK

×

Interworks GmbH
Ratinger Straße 9
40213 Düsseldorf
Germany
Geschäftsführer: Mel Stephenson

Kontaktaufnahme: markus@interworks.eu
Telefon: +49 (0)211 5408 5301

Amtsgericht Düsseldorf HRB 79752
UstldNr: DE 313 353 072

×

Love our blog? You should see our emails. Sign up for our newsletter!