Our Certified Tableau Trainers are asked a myriad of questions each day. In this series, they share some answers.
“How can I draw a 45-degree angle in Tableau, starting from the lower left-hand corner of my view and ending in the top-right corner?”
This question came from Ece during a Desktop III class in Atlanta, as well as Christa and Erik from a Visual Analytics class in Boston. This must be a popular topic!
Perhaps you are trying to draw a line all the way from zero to a fundraising goal, or maybe you are trying to figure out who is above or below a certain threshold. Whatever the case, this will allow us to draw a line from zero to our goal or final amount.
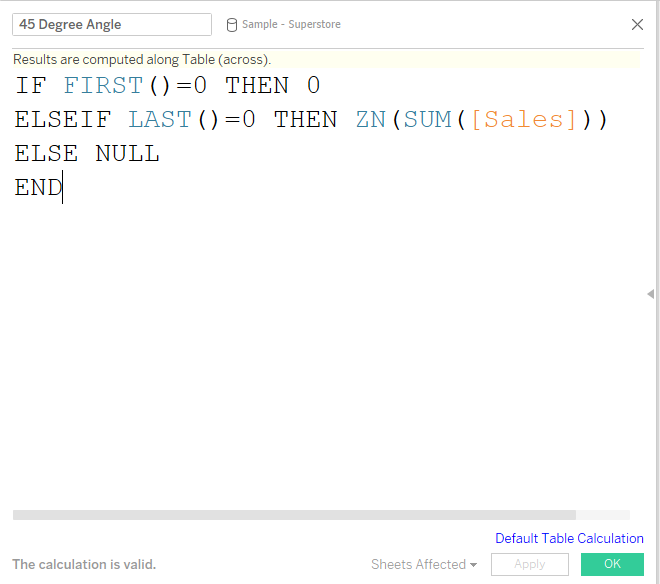
Creating Our Calculation
While this task is straightforward with a scatter plot, this approach did not work for our use case: viewing data over time. However, by utilizing our helper functions in Tableau, we can create a calculation that will draw a line from zero all the way to the last point in our data.

What this calculation is essentially doing is looking at our time series and determining what is first and last in the view. For our first mark, it will simply plot a mark at zero. For our last mark, it will plot a mark at our last sales amount. For everything else, it will simply be null, which is important. We don’t want the 45-degree line to consider any highs or lows in other months.
Plotting Our Line
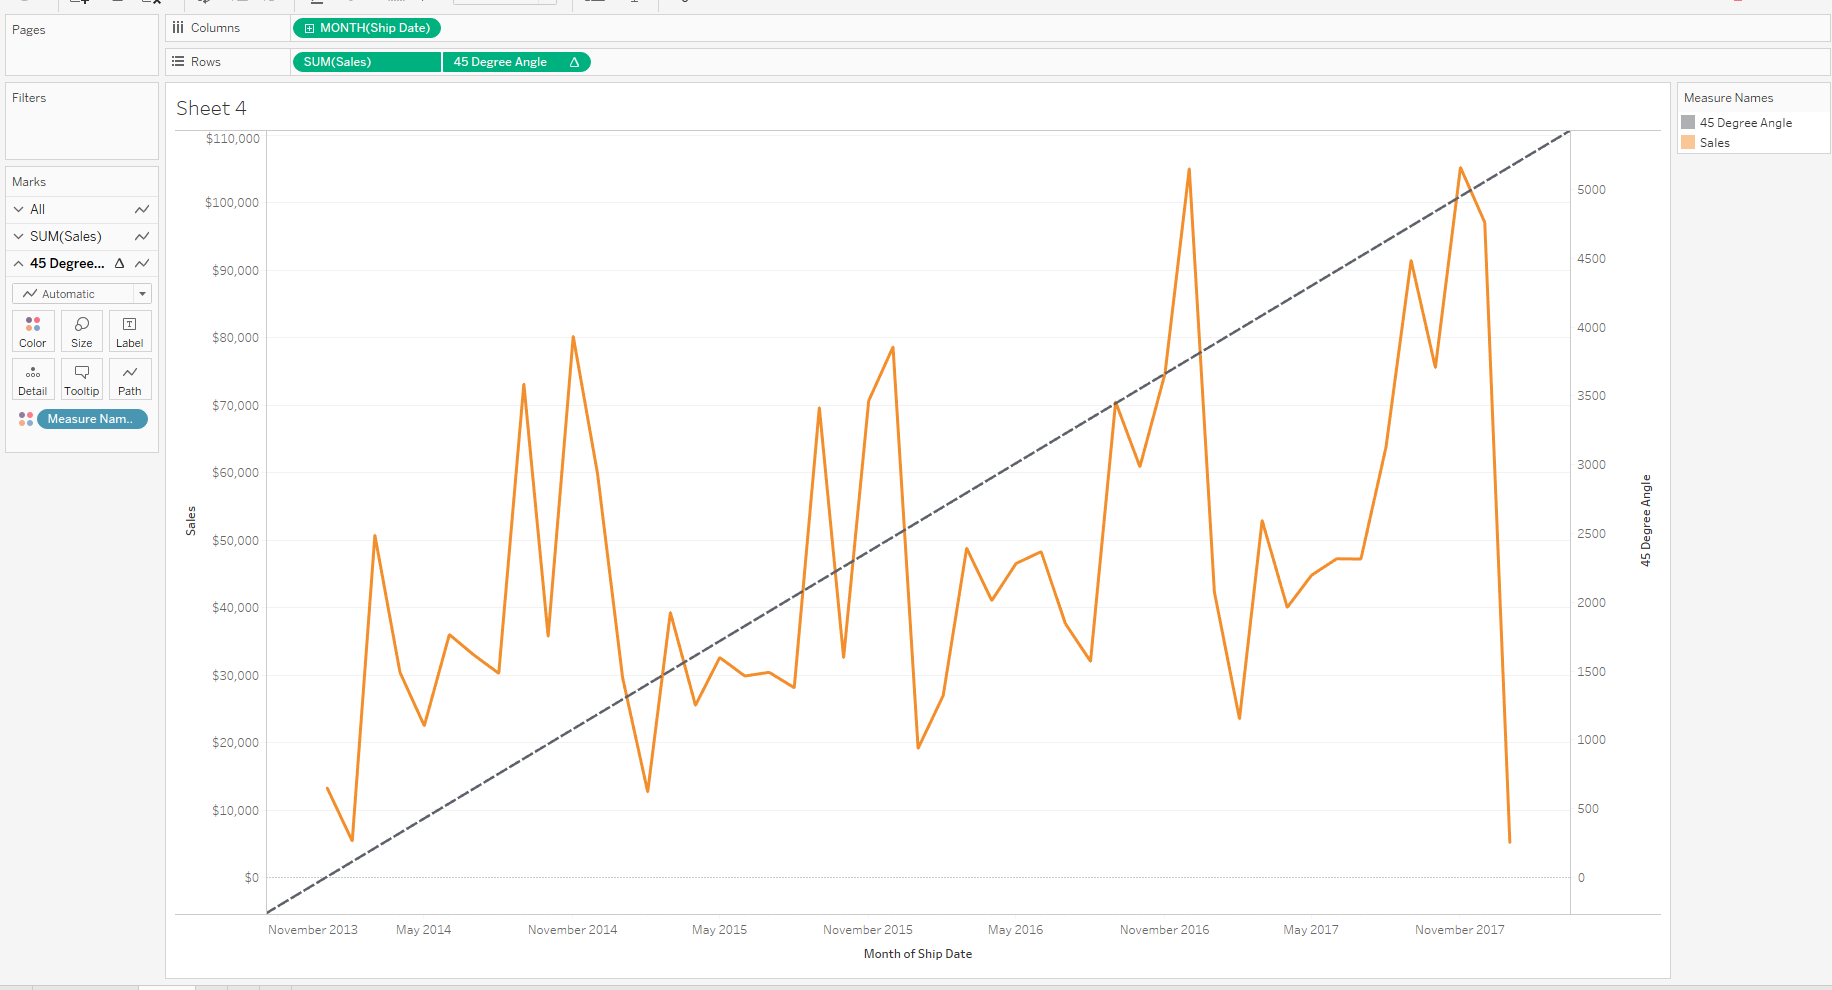
Once I have my calculation, I can drop it on Rows next to my sales amount and add a trend line between my two points (right-click on one of your dots to add the trend line). I am not going to synchronize my axis; as you can see, my sales axis is much higher than my 45-degree angle line’s axis.
For some other formatting changes, I can decrease the opacity of my color on my 45-degree angle line, change the color of the trend line and hide my null indicator. You can also completely hide that second axis if you so choose.

Thanks for the great question, Ece, Christa and Erik!

