Questions from Tableau Training: How to Use Specific Dimensions in Table Calculations

Data

Questions from Tableau Training: How to Use Specific Dimensions in Table Calculations

by Liz Jensen
//

Our Certified Tableau Trainers are asked a myriad of questions each day. In this series, they share some answers.

In a Desktop II: Intermediate course I recently taught, a student asked, “When would I ever need the specific dimensions option with table calculations?” This is a great question! We know that we can utilize the prebuilt options in our table calculation dialog box to choose scope and direction options like table down and pane across.

Luckily, Tableau recently updated its calculation dialog box and made setting the scope and direction of our calculations more flexible than ever! We can use specific dimensions to choose exactly what we want to include in our table calculations.

As per Tableau, what is checked is addressed in the table calculation and what is unchecked is how the table calculation is partitioned. How can we utilize these concepts of addressing and partitioning in a table calculation?

How to See the Whole Pie

Let’s use percent of total as an example. Whenever I teach this calculation, I like my students to imagine that they are creating a pie chart. What is the overall pie chart and what is each slice of the pie? Essentially, that is all addressing and partitioning are. What you check is a slice and what is unchecked is the entire pie.

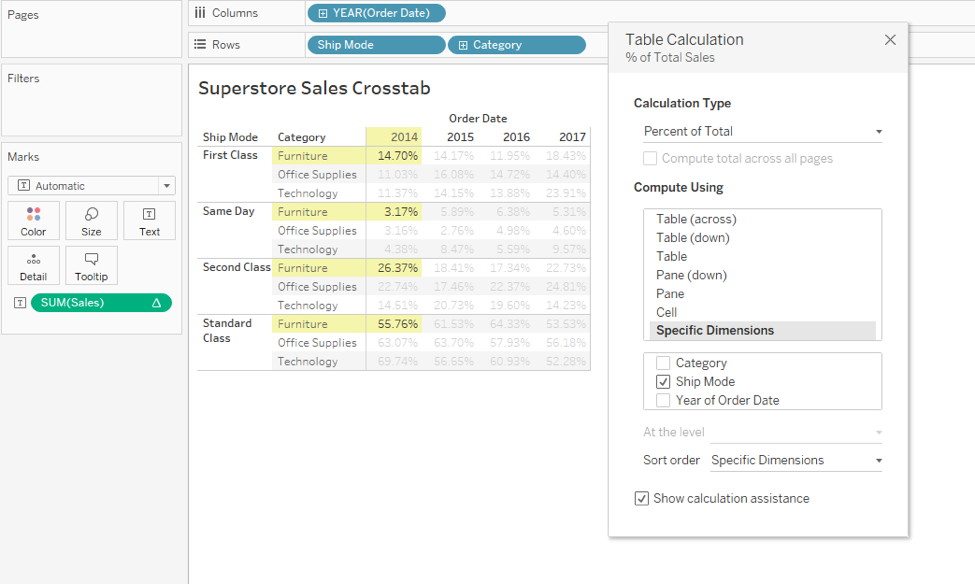
In the Superstore dataset example below, I have Ship Mode checked. I also have Category and Year of Order Date unchecked so I can use these dimensions for partitioning. More simply put, I am seeing what each Ship Mode makes up across that year and category. In the image below, 2014 Furniture Sales would be the entire pie and each Ship Mode is a separate slice:

Tableau dimensions in table calculations

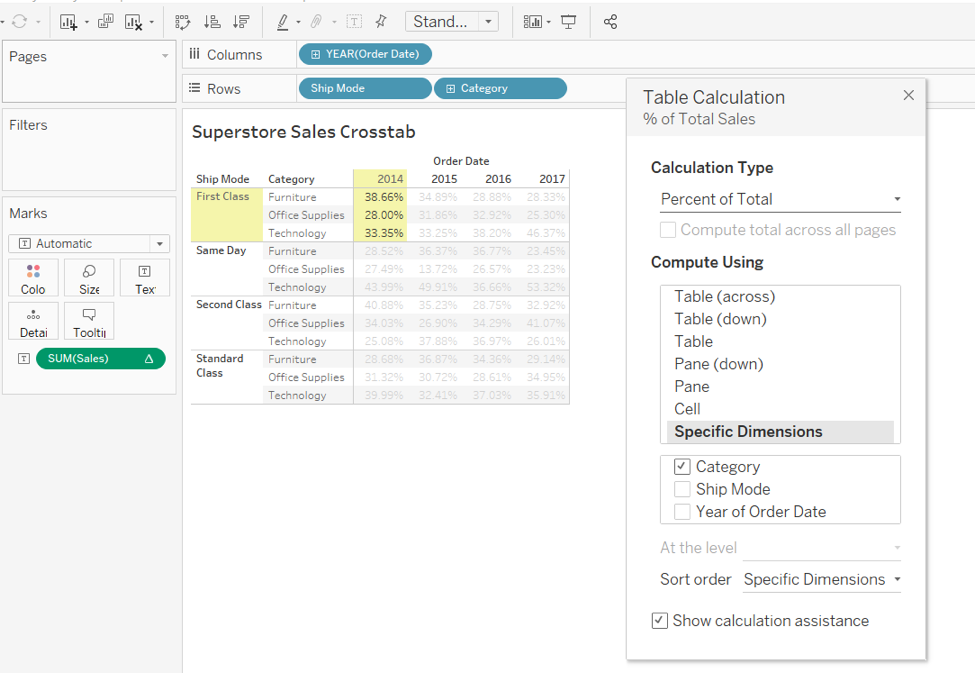
Let’s look at this crosstab in a more visual format: a pie chart. Using the same table calculation, each Category and Year of Order Date become their own pie chart. Each slice is a Ship Mode. Below, If you look at using the Specific Dimensions option of Category as the addressing dimension and Ship Mode and Year of Order Date as the partitioning dimensions, it is identical to using the Pane (down) option:

Tableau dimensions in table calculations

In many of our crosstabs, we can make do with the prebuilt options for scope and direction. However, when we look at more visual charts, like the bar chart below, we can see how using Specific Dimensions can really come in handy:

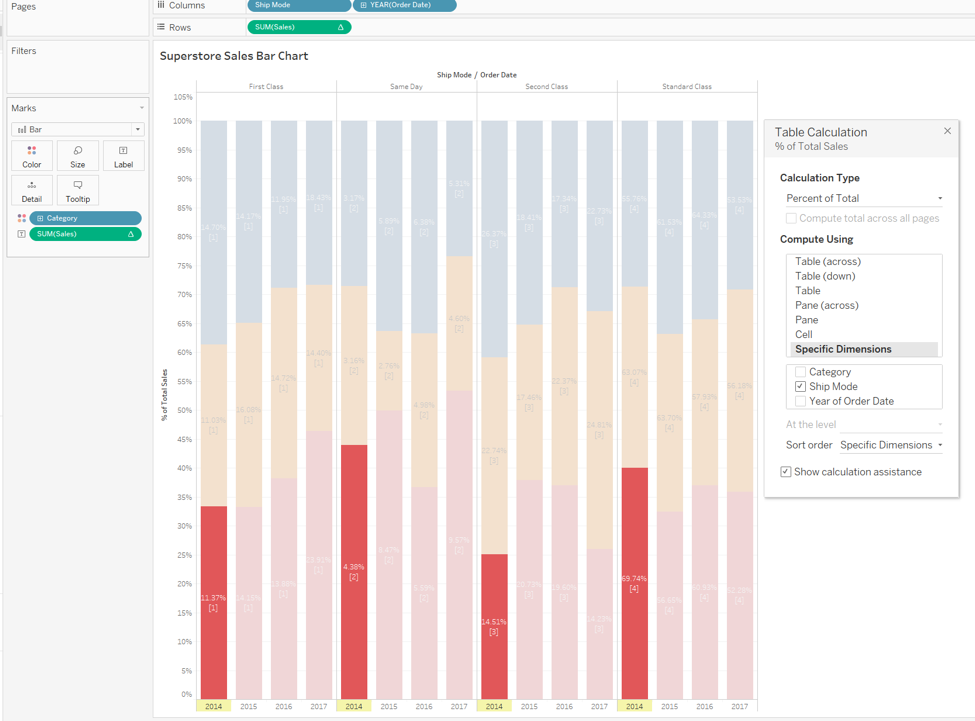
Using the Specific Dimension options of Ship Mode as our addressing field and Category and Year of Order Date as our partitioning fields, we can get more creative with our table calculation. Here we see which Year of Order Date and Category make up Ship Modes. Since there is no prebuilt option that would allow us to analyze this unique combination of addressing and partitioning dimensions, we must use our Specific Dimensions options.

I encourage you to try using Specific Dimensions for your table calculations, particularly for Percent of Total. This method can provide the precision and granularity to achieve exactly what table calculation you have in mind. 

Want More Questions from Tableau Training

  1. Questions from Tableau Training: Quick Filter Interaction
  2. Questions from Tableau Training: Labeling with Table Calculations
  3. Questions from Tableau Training: Speeding Up Presentation Views when Using Tableau
  4. Questions from Tableau Training: Dashboard Actions
  5. Questions from Tableau Training: Business Day Calculations
  6. Questions from Tableau Training: Adding Gaps Between Bars
  7. Questions from Tableau Training: When to Pivot Data in Tableau
  8. Questions from Tableau Training: Adding Conditional Formatting
  9. Questions from Tableau Training: Setting Weekday Start
  10. Questions from Tableau Training: How Do ZIP Codes Work in Tableau?
  11. Questions from Tableau Training: The Small Grey Bar Within a Quick Filter
  12. Questions from Tableau Training: Matching Mark Color
  13. Questions from Tableau Training: Showing the Null Indicator
  14. Questions from Tableau Training: Can I Manually Set the Colors of a Stepped Gradient?
  15. Questions from Tableau Training: How Can I Get Box Plot Data into a Crosstab?
  16. Questions from Tableau Training: How Do I Clear a Worksheet? Make a Copy?
  17. Questions from Tableau Training: Opening URL Actions Inside of a Dashboard
  18. Questions from Tableau Training: Can I Move Mark Labels?
  19. Questions from Tableau Training: How Can I Use My Current Report to Create a Viz?
  20. Questions from Tableau Training: Can I Create Text Hyperlinks on a Dashboard?
  21. Questions from Tableau Training: How Can I Transform My Crosstab into a Flat List?
  22. Questions from Tableau Training: Labeling the Top N
  23. Questions from Tableau Training: How Can I Customize Charts with Parameters?
  24. Questions from Tableau Training: Combining Measures into a Single Line
  25. Questions from Tableau Training: How Can I Create Custom Color Palettes?
  26. Questions from Tableau Training: Can a Top N Parameter be Nested Within Other Fields?
  27. Questions from Tableau Training: Conditional Scope on Tableau Calculations
  28. Questions from Tableau Training: Top Ten Plus N
  29. Questions from Tableau Training: Dynamic Label Positioning
  30. Questions from Tableau Training: Using Cross Joins to Solve Active Tickets
  31. Questions from Tableau Training: Top N Highlight Table
  32. Questions from Tableau Training: How to Use Specific Dimensions in Table Calculations
  33. Questions from Tableau Training: Moving Reference Line Labels
  34. Questions from Training: Comparing Metrics for Same Weekday in Previous Year
  35. Questions from Tableau Training: Colouring Specific Columns and Rows in a Crosstab
  36. Questions from Tableau Training: Creating a Custom Legend as a Sheet
  37. Questions from Tableau Training: How Can I Draw a 45-Degree Angle?
  38. Questions from Tableau Training: Down the Aggregation Rabbit Hole
  39. Questions from Tableau Training: Percent Change from Previous Period on a Map
  40. Questions from Tableau Training: Union File Names as Years
  41. Questions from Tableau Training: Conditional Coloring on Sparklines
  42. Questions from Tableau Training: Moving Column Headers to the Top of the View
  43. Questions from Tableau Training: Isolating Rank with Parameters and Calculations

More About the Author

Liz Jensen

Analytics Consultant
Alter Your Analysis: Unofficial Holidays We know what dates Halloween, Christmas, and US Independence Day are on. But what about National Dogs in Politics Day or National ...
Alter Your Analysis: Women’s World Cup Match Wins In this second installment of Alter Your Analysis, I am tackling Alteryx’s Weekly Challenge 169: “Using the values in the attached file ...

See more from this author →

InterWorks uses cookies to allow us to better understand how the site is used. By continuing to use this site, you consent to this policy. Review Policy OK

×

Interworks GmbH
Ratinger Straße 9
40213 Düsseldorf
Germany
Geschäftsführer: Mel Stephenson

Kontaktaufnahme: markus@interworks.eu
Telefon: +49 (0)211 5408 5301

Amtsgericht Düsseldorf HRB 79752
UstldNr: DE 313 353 072

×

Love our blog? You should see our emails. Sign up for our newsletter!