Questions from Tableau Training: The Small Grey Bar Within a Quick Filter

Data

Questions from Tableau Training: The Small Grey Bar Within a Quick Filter

by Jon Bajon
//

Our Certified Tableau Trainers are asked a myriad of questions each day. In this series, they share some answers.

A common question that comes up trainings is:

”What does the small grey bar within the quick filter box represent?”

Using quick filters is one of the easiest ways to provide end users with the ability to control what they want to see. Although they are quick, they are not always recommended when optimizing your reports. See The Tableau Performance Checklist for more info. But when quick filters are used, why is there sometimes a small grey bar within the range of values?

Let’s look at a sample report with a quick filter on sales:


Tableau quick filter

Pointer

Sales bar chart

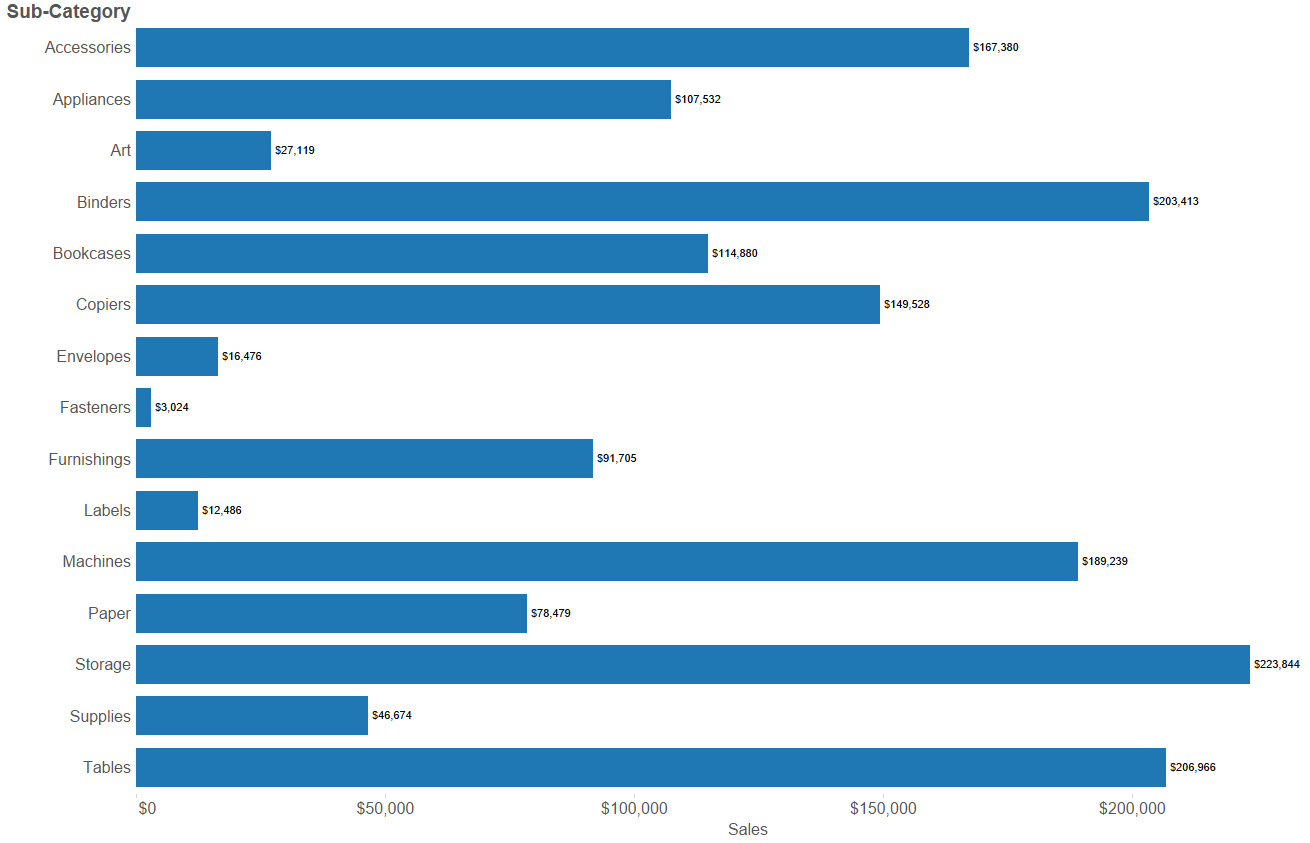
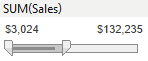
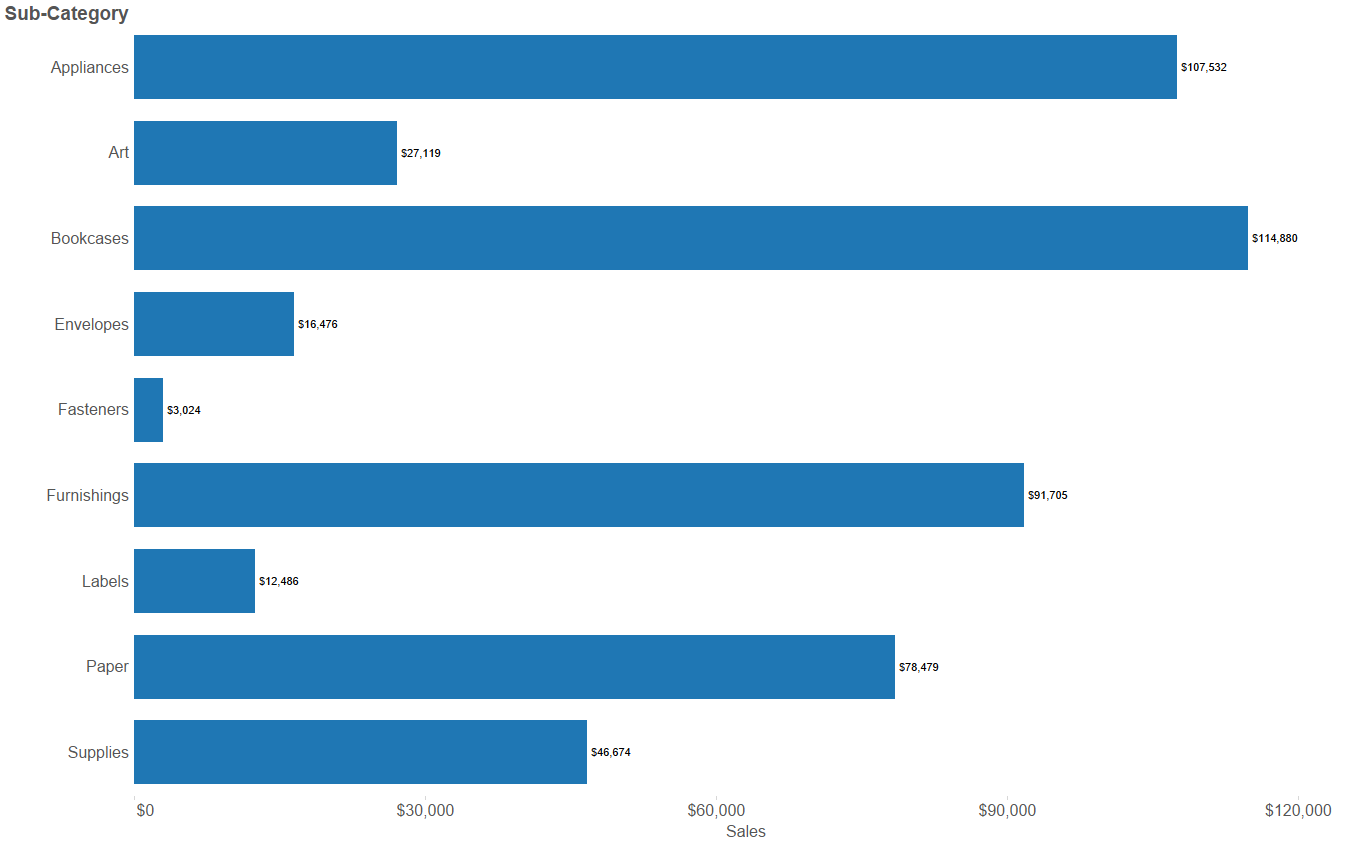
In this example, the small grey bar represents the value $223,844, which is the largest sum of sales value displayed in the visualization. It shows how far I can reduce the upper sum of sales limit until the largest sum of sales sub-category is removed. As I move the right slider past the small grey bar, the visualization is re-rendered once I stopped at $132,235:

Grey Bar

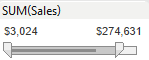
The view now shows only nine sub-categories with the highest sum of sales value being $114,880. The small grey bar still exists, but this time represents the $114,880 value. Once again, this value marks the distance the slide can be reduced to until the next sub-category will be removed.

Grey Bar

Sales bar chart 

Want More Questions from Tableau Training

  1. Questions from Tableau Training: Quick Filter Interaction
  2. Questions from Tableau Training: Labeling with Table Calculations
  3. Questions from Tableau Training: Speeding Up Presentation Views when Using Tableau
  4. Questions from Tableau Training: Dashboard Actions
  5. Questions from Tableau Training: Business Day Calculations
  6. Questions from Tableau Training: Adding Gaps Between Bars
  7. Questions from Tableau Training: When to Pivot Data in Tableau
  8. Questions from Tableau Training: Adding Conditional Formatting
  9. Questions from Tableau Training: Setting Weekday Start
  10. Questions from Tableau Training: How Do ZIP Codes Work in Tableau?
  11. Questions from Tableau Training: The Small Grey Bar Within a Quick Filter
  12. Questions from Tableau Training: Matching Mark Color
  13. Questions from Tableau Training: Showing the Null Indicator
  14. Questions from Tableau Training: Can I Manually Set the Colors of a Stepped Gradient?
  15. Questions from Tableau Training: How Can I Get Box Plot Data into a Crosstab?
  16. Questions from Tableau Training: How Do I Clear a Worksheet? Make a Copy?
  17. Questions from Tableau Training: Opening URL Actions Inside of a Dashboard
  18. Questions from Tableau Training: Can I Move Mark Labels?
  19. Questions from Tableau Training: How Can I Use My Current Report to Create a Viz?
  20. Questions from Tableau Training: Can I Create Text Hyperlinks on a Dashboard?
  21. Questions from Tableau Training: How Can I Transform My Crosstab into a Flat List?
  22. Questions from Tableau Training: Labeling the Top N
  23. Questions from Tableau Training: How Can I Customize Charts with Parameters?
  24. Questions from Tableau Training: Combining Measures into a Single Line
  25. Questions from Tableau Training: How Can I Create Custom Color Palettes?
  26. Questions from Tableau Training: Can a Top N Parameter be Nested Within Other Fields?
  27. Questions from Tableau Training: Conditional Scope on Tableau Calculations
  28. Questions from Tableau Training: Top Ten Plus N
  29. Questions from Tableau Training: Dynamic Label Positioning
  30. Questions from Tableau Training: Using Cross Joins to Solve Active Tickets
  31. Questions from Tableau Training: Top N Highlight Table
  32. Questions from Tableau Training: How to Use Specific Dimensions in Table Calculations
  33. Questions from Tableau Training: Moving Reference Line Labels
  34. Questions from Training: Comparing Metrics for Same Weekday in Previous Year
  35. Questions from Tableau Training: Colouring Specific Columns and Rows in a Crosstab
  36. Questions from Tableau Training: Creating a Custom Legend as a Sheet
  37. Questions from Tableau Training: How Can I Draw a 45-Degree Angle?
  38. Questions from Tableau Training: Down the Aggregation Rabbit Hole
  39. Questions from Tableau Training: Percent Change from Previous Period on a Map
  40. Questions from Tableau Training: Union File Names as Years
  41. Questions from Tableau Training: Conditional Coloring on Sparklines
  42. Questions from Tableau Training: Moving Column Headers to the Top of the View
  43. Questions from Tableau Training: Isolating Rank with Parameters and Calculations

More About the Author

Jon Bajon

Analytics Consultant
Tableau Viz: How Much Heat Can You Handle? It might sound controversial, but a common practice in my family (and many families throughout Louisiana) was something called ...
Questions from Tableau Training: Can a Top N Parameter be Nested Within Other Fields? The latest question from Tableau Training comes from Ryan, who was in a DII: Intermediate course in New York City. “I know I can ...

See more from this author →

InterWorks uses cookies to allow us to better understand how the site is used. By continuing to use this site, you consent to this policy. Review Policy OK

×

Interworks GmbH
Ratinger Straße 9
40213 Düsseldorf
Germany
Geschäftsführer: Mel Stephenson

Kontaktaufnahme: markus@interworks.eu
Telefon: +49 (0)211 5408 5301

Amtsgericht Düsseldorf HRB 79752
UstldNr: DE 313 353 072

×

Love our blog? You should see our emails. Sign up for our newsletter!