The Tableau Performance Checklist series is designed to help you streamline your dashboard performance and Tableau Server configuration. Each post expands upon one item listed in the master Tableau Performance Checklist. As of 2024, you can find an updated Tableau Dashboard Performance Checklist here.
We’ll continue on with the next item in the Filtering category:
“Replace quick filters showing ‘Only Relevant Values’ and high count of quick filters with dashboard filter actions. They will cascade as your user interacts, and they perform faster.“
Cascading filters? Sounds exciting!
I Got 99 Problems …
As we discussed here, here, and here in previous Tableau Performance Checklist articles, there are big potential performance problems when you use quick filters. Whether this is too many quick filters, using the Only Relevant Values option or using quick filters that have a lot of values (i.e. high-cardinality), you are going to impact the performance of your dashboard.
The gist of the problem is that the Tableau must do extra work behind the scenes to populate the values for these quick filters. This often means multiple sub-queries before Tableau can finish loading.
… and a Filter Action Ain’t One
Dashboard filter actions to the rescue! We’ve already addressed why dashboard filter actions are an optimal replacement for multiple quick filters here and how to build dashboard actions here. In short, they do not require Tableau to run additional queries and add a level of intuition to the user experience in interacting with your dashboard. This is because there are no quick filters that must be queried and populated before the view can load. The filter works on a user action, such as clicking on a mark. Not only that, but dashboard filter actions can apply across the dashboard whereas global quick filters will apply to the entire workbook, which more often than not is not desired.
Let’s now address how dashboard filter actions can work as cascading filters.
Cascading Filters
Cascading filters operate by working in a filter hierarchy. The top-level filter, when a value is selected, will reduce the options available in the other filters. For instance, let’s assume that the top-level filter is Region and we select West. With cascading filters, that selection would then change the options in the State filter to all of the western states.
Dashboard filter actions work best in tandem in guided analytical paths that allow the report consumer to drill further down from the macro into the micro. Let’s take a look at an example:
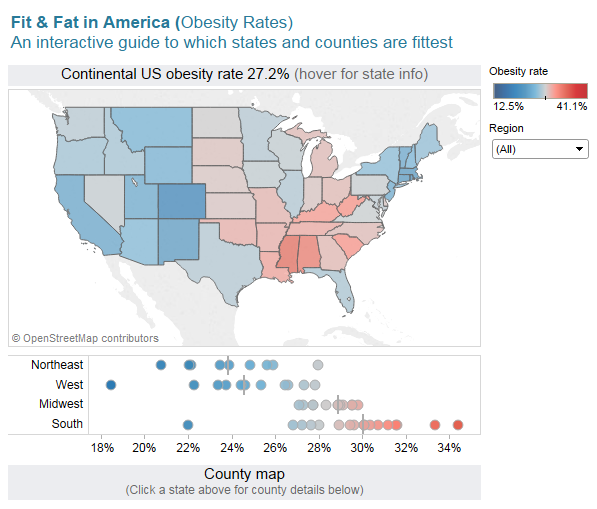
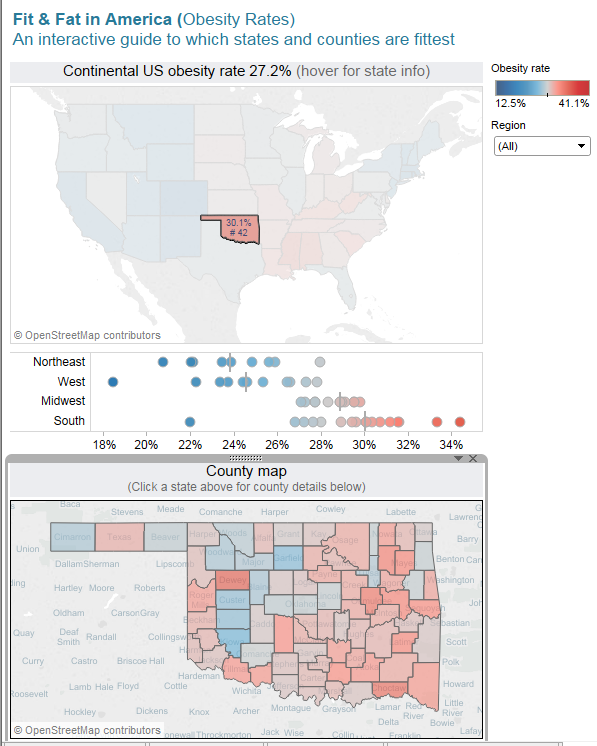
Our view above allows us to filter by clicking on a state on the USA map, to filter on a region by clicking on any of the region names, or to filter on a state by clicking on any of the marks in the plot. Using any of these filter actions will bring up the county map at the bottom:
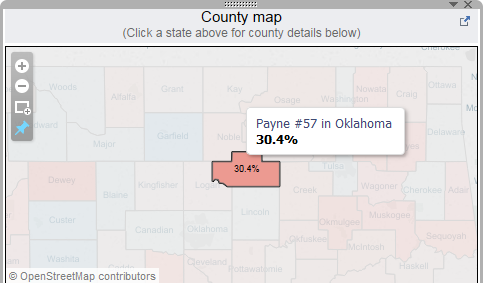
We can filter again by clicking on any of the counties for even more information:
Mastering Best Practices
If you’re interested in becoming a Tableau Server guru, then learning these performance best practices is essential. Check back frequently as we add new posts and dive deeper into each point in the Tableau Performance Checklist.
Another great way to identify best practices is to leverage the insights offered by our Performance Analyzer, part of Workbook Tools for Tableau. It will examine all of your workbooks, worksheets, dashboards and data sources against a list of best practices to ensure that you’re using all the tips and tricks to guarantee your visualizations are moving at light speed.
As always, feel free to get in touch with us if you have any questions regarding performance or anything Tableau related! We’d be happy to help.