
The Tableau Performance Checklist series is designed to help you streamline your dashboard performance and Tableau Server configuration. Each post expands upon one item listed in the master Tableau Performance Checklist. As of 2024, you can find an updated Tableau Dashboard Performance Checklist here.
The first topic we’ll be covering in this new series is Data, and the first point on the checklist is as follows:
“Keep analysis simple. Work with a subset of your data. Extract a sample if needed.”
The old adage, “Keep It Simple, Stupid” is just as true in Tableau dashboard design as it is everywhere else. Take these examples for Sales by Item:
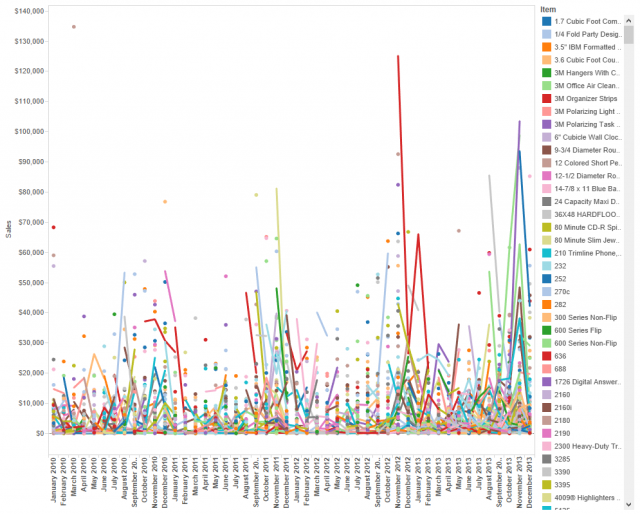
Figure 1: A cluttered viz.
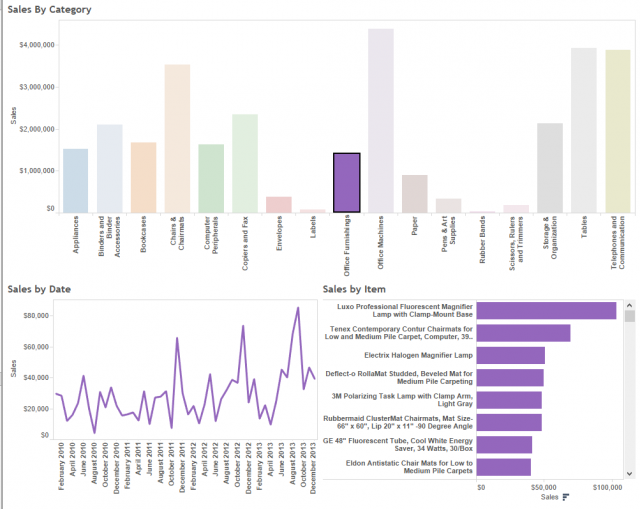
Figure 2: Simplified analysis.
Which viz above do you think communicates the data more effectively? There’s certainly nothing wrong with making your vizzes detailed, but too many details can distract from your central point, whatever that may be. Still, there’s more to clear and concise visual analysis than just layout. We need to go deeper.
It Starts with Good Preparation
Just as important to your visualization is how you prepare your data for your worksheets. It can have a tremendous impact on their performance. There are a few things to consider when trying to keep your data as trim and streamlined as possible.
Dashboard Performance
Your visualizations can only perform as fast as your underlying data sources. That is the great performance inhibitor that makes great dashboards into headaches. The key to improving performance for slow data is to extract only the data that is needed for the worksheet to perform its analysis.
Report Portability
When you create a data extract, you create a TDE that can serve a single workbook or multiple workbooks. The good news is that a TDE can be packaged with a workbook as a self-contained reporting suite that is not reliant on a connection back to the data source. As such, it can be shared and disseminated far more easily than a workbook that relies on a live data connector.
*** Caution: Keep security in mind when utilizing TDEs in a TWBX.
Data Source Efficiency
Not only can a data extract improve the performance of your dashboard, but you can also improve the efficiency and performance of the data source itself. A data extract does not need to communicate with the data source from which it was drawn. It is a self-contained data subset.
Aggregated Extracts
When you create a data extract, Tableau also gives you the option to aggregate your data for all visible dimensions. When these pre-aggregations are used, the data extract is called an “aggregated extract.” This type of extract does not contain the row-level data. Rather, it contains only the aggregated data. It’s ideal for some visualizations, depending on the type of analysis performed. An aggregated extract is smaller than a standard data extract, and it creates another level of efficiency in generating fast performance with your dashboards and worksheets.
Calculated Fields
When you create a data extract, all calculated fields in the extract are converted to static fields. This is a great way to reduce the heavy lifting of the data source whenever data is accessed via a live connection. Calculated fields that are converted into static values can be accessed and aggregated as easily as any other field. These are particularly effective when dealing with string calculations, which are far more resource-heavy than numeric or date calculations.
For more insight on calculated fields, check out this blog.
Mastering Best Practices
If you’re interested in becoming a Tableau Server guru, then learning these performance best practices is essential. Check back frequently as we add new posts and dive deeper into each point in the Tableau Performance Checklist.
Another great way to identify best practices is to leverage the insights offered by our Performance Analyzer, part of Workbook Tools for Tableau. It will examine all of your workbooks, worksheets, dashboards and data sources against a list of best practices to ensure that you’re using all the tips and tricks to guarantee your visualizations are moving at light speed.
As always, feel free to get in touch with us if you have any questions regarding performance or anything Tableau related! We’d be happy to help.