Our Certified Tableau Trainers are asked a myriad of questions each day. In this series, they share some answers.
Continuing with the ‘Questions from Tableau Training’ series, I was asked a labeling question with regards to a time series chart. The question was:
“How you can get multiple labels combined into one tooltip?”
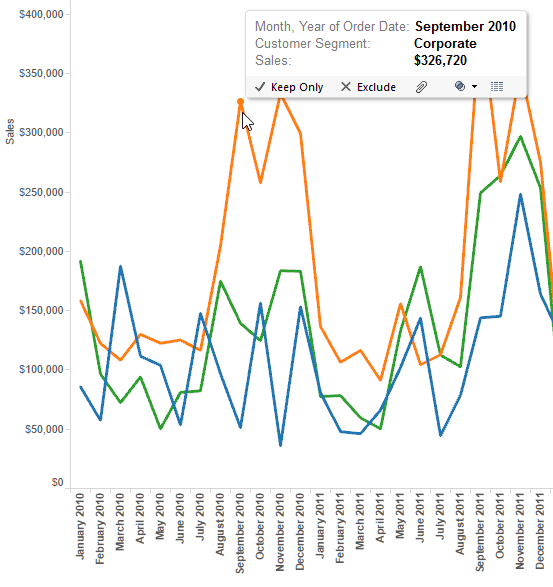
The example that we were working on was a time series chart for Sales by Customer Segment in the Superstore data set that comes with Tableau. The desire was for the tooltip to contain all data for the specific date.
By default, Tableau only places the data revolving around the single mark in the tooltip. Looking at the screenshot below, you can see that we only see Corporate Sales Amounts on the mark we are hovering over.

In order to be able to get all three marks for each date to appear in the tooltip, we need to create a calculated field that uses the table calculation function TOTAL(). We need to identify the customer segment line, and return the sales amount for the line, per date. The formula we ended up using looks like this:

Using an IF Statement, we identify the Customer Segment Line and return the Sales Amount. To be able to use the TOTAL table calculation function, all fields must be aggregate. That’s why we added Sum to the formula.
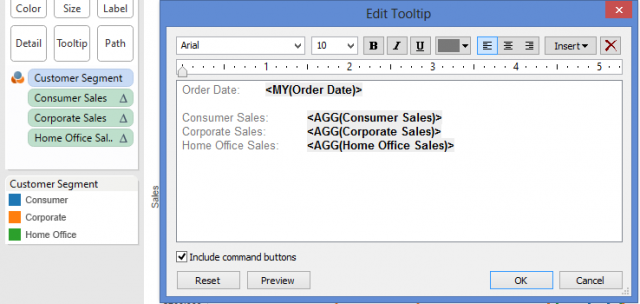
Since we have three lines in the chart for Customer Segment, we must create three calculated fields. Once these three fields are created, place them on the Tooltip shelf in the Marks card. “Right Click” each pill, and compute the table calc using Cell. This gives us the Total for each segment, per each date, based on the way we’ve built the chart. I’ve modified the Tooltip layout to look like the one below:

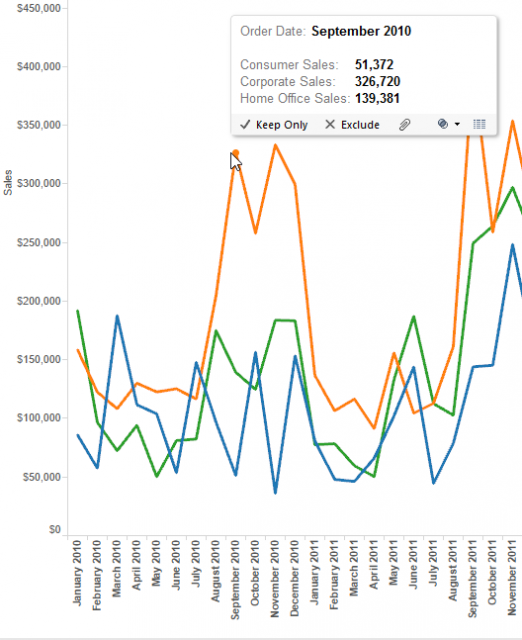
When you hover on your mark in your chart now, all three marks for that specific date appear for comparison.

I’m sure there may be other ways by which people have solved this issue, but this is the solution that we came up with for our specific scenario and time available. If you have another method you’ve used to solve this before, I’d love to see it. Feel free to email me at dustin.wyers@interworks.com.
You can also check out other “Questions from Tableau Training” posts here.
All the best!

