The Tableau Performance Checklist series is designed to help you streamline your dashboard performance and Tableau Server configuration. Each post expands upon one item listed in the master Tableau Performance Checklist. As of 2024, you can find an updated Tableau Dashboard Performance Checklist here.
Here’s the first guideline from the Local Computations category:
“Even if a workbook is published to Tableau Server, local computations still impact performance. Leverage the power of Tableau Server whenever possible by limiting local computations such as groups, hierarchies, reference lines, table calculations and blending.”
Let’s get started!
Computation vs. Calculation
Perhaps it is best to start with the difference between a computation and a calculation. Though they may seem to be perfectly synonymous, there is, in fact, a little bit of a difference. A calculation involves pure arithmetic, such as calculating the interest due on a loan. A computation is instead applying a series of rules, like an algorithm, to derive an answer. An example of a computation might be assessing the FICO score of a potential borrower.
Local computations are not limited just to Tableau calculations, such as table calculations; they also include a whole host of additional functionalities.

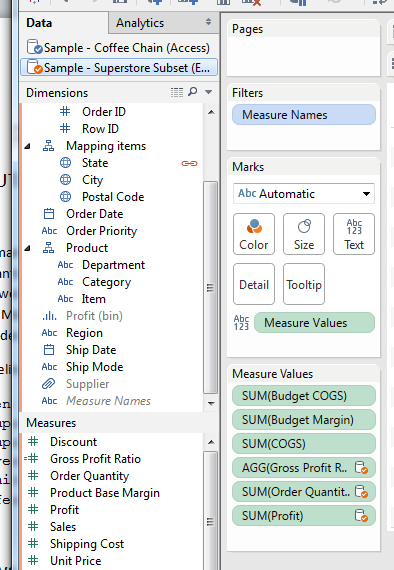
Above: Blending can affect performance, do so wisely.
Local Computations on Server
As our guideline stated above, even though it is called a local computation, most of them are actually computed and rendered on Tableau Server. Tableau Server on its default mode uses a Threshold Calculation to determine the complexity of a dashboard. This threshold is 100 for PCs and 20 for tablets. If the dashboard of visualization exceeds this amount, then most of the rendering will be server-side rather than client-side. This is beneficial because the resources on the machine running Tableau Server are normally far more powerful and can tackle complex dashboard with greater ease.
The problem with server-side rendering is that a particularly heavy visualization or dashboard still requires the resources on Tableau server rather than off-loading it to the report consumer’s local machine. Unnecessary or excessive computations will drag down the resources on Tableau Server, slowing down everything.
It is evident that with hundreds or perhaps even thousands of users accessing this report, the strain on you Tableau Server can grow excessive and can impact performance. The best way to tackle this problem is to use the underlying database to do the calculations there and then use that in your visualization.
Mastering Best Practices
If you’re interested in becoming a Tableau Server guru, then learning these performance best practices is essential. Check back frequently as we add new posts and dive deeper into each point in the Tableau Performance Checklist.
Another great way to identify best practices is to leverage the insights offered by our Performance Analyzer, part of Workbook Tools for Tableau. It will examine all of your workbooks, worksheets, dashboards and data sources against a list of best practices to ensure that you’re using all the tips and tricks to guarantee your visualizations are moving at light speed.
As always, feel free to get in touch with us if you have any questions regarding performance or anything Tableau related! We’d be happy to help.

